 Earn Money Forex Best Forex Trading Experience


Bollinger Band Strategies (Part-10)
Dear Friends…….
Thanks for visit earnmoneyfx.com
Hope that if you visit this Bollinger Band Strategy Series, you must inform that
earnmoneyfx.com research team suggests you to follow various type entry-exit strategies
of Bollinger Band as below:
1. Candlesticks Pattern with Bollinger Band Strategy.
2. Double Top Chart Pattern with Bollinger Band Strategy.
3. Double Bottom Chart Pattern with Bollinger Band Strategy.
4. Reversal or Counter Candlesticks with Bollinger Band Strategy.
5. Trend line Breakout with Bollinger Band Strategy.
6. Swing Trading with Middle Band (20 Simple Moving Average) Bollinger Band
Strategy.
7. Walking with Bollinger Band Strategy.
8. Ascending Triangle with Bollinger Band Strategy.
9. Descending Triangle with Bollinger Band Strategy.
10. Symmetrical Triangle with Bollinger Band Strategy.
11. Flag Pattern with Bollinger Band Strategy.
12. Channel with Bollinger Band Strategy.
13. Candlesticks Pattern with Bollinger Band Strategy.
14. Golden Cross with Bollinger Band Strategy.
15. Death Cross with Bollinger Band Strategy.
16. Double Golden Cross with Bollinger Band Strategy.
17. Double Death Cross with Bollinger Band Strategy.
18. Short term & Midterm moving average cross with Bollinger Band Strategy.
19. Multi time frame analysis with Bollinger Band Strategy.
20. 200 Simple Moving Average with Bollinger Band Strategy etc.
We have discussed Bollinger Band Entry-Exit Strategy (Part -1) about Candlesticks
Pattern with Bollinger Band and Double Top Chart Pattern with Bollinger Band.
Bolinger band strategy (part-1)
The above link is for your easy references.
We have discussed the Bollinger Band Entry-Exit Strategy (Part -2) Double Bottom Chart
Pattern with Bollinger Band and Reversal or Counter Candlesticks with Bollinger
Band.
Bollinger band strategy (part-2)
The above link is for your easy references.
We have discussed Bollinger Band Entry-Exit Strategy (Part -3) about Trend line
Breakout with Bollinger Band.
Bollinger band strategy (part-3)
The above link is for your easy references.
We have discussed Bollinger Band Entry-Exit Strategy (Part -4) about Swing Trading with
Middle Band (20 Simple Moving Average) Bollinger Band.
Bollinger band strategy (part-4)
The above link is for your easy references. We have discussed Bollinger Band Entry-Exit
Strategy (Part -5) about 200 Simple Moving Average with Bollinger Band.
Bollinger band strategy (part-5)
The above link is for your easy references.
We have discussed Bollinger Band Entry-Exit Strategy (Part -6) about Walking with
Bollinger Band.
Bollinger band strategy (part -6)
The above link is for your easy references.
We have discussed Bollinger Band Entry-Exit Strategy (Part -7) about Ascending Triangle
with Bollinger Band Entry-Exit Strategy, Descending Triangle with Bollinger Band
Entry-Exit Strategy and Symmetrical Triangle with Bollinger Band Entry-Exit
Strategy.
Bollinger band strategy (part-7)
The above link is for your easy references.
We have discussed Bollinger Band Entry-Exit Strategy (Part -8) about Flag Pattern with
Bollinger Band Entry-Exit Strategy, Channel with Bollinger Band Entry-Exit Strategy.
Bollinger band strategy (part-8)
The above link is for your easy references.
We have discussed Bollinger Band Entry-Exit Strategy (Part -9) about Golden Cross with
Bollinger Band Entry-Exit Strategy, Death Cross with Bollinger Band Entry-Exit
Strategy.
Bollinger band strategy (part-9)
The above link is for your easy references.
earnmoneyfx.com research teams explain another strategy as below.
*** Double Golden Cross with Bollinger Band Entry-Exit Strategy ***
*** Double Death Cross with Bollinger Band Entry-Exit Strategy ***
You can try it any timeframe and any pair and this suggestion provide you based on as per
earnmonreyfx.com research team demo test result.
However EURUSD, GBPUSD, AUDUSD, NZDUSD, USDCHF, USDCAD, USDJPY, EURJPY,
GBPJPY, XAUUSD, XAUEUR, CRUIDE OIL and S&P500 suggest you for better result.
Also, One Hourly, Four Hourly, Daily timeframe are suggested.
Let’s enjoy all ……….
Before discussion about Bollinger Band strategy, at first, we want to know what is Bollinger
Band and calculation of Bollinger Band.
What is the Bollinger Band?
John Bollinger developed a Bollinger Band. Also, Bollinger Band® is a registered trademark
by John Bollinger.
Bollinger Band is very simple with three parts. Upper Band, Middle Band, and Lower
Band.
Upper Band and Lower Band are volatility-based Bands which based on standard deviation.
Volatility increase and decreases measured by the standard deviation. Standard deviations 2 set
in upper Band and lower Band usually.
The band automatically widen when volatility increases and the band automatically
contract when volatility decreases.
20 Simple Moving Average act as a Middle Band. Though Simple Moving Average use in the
standard deviation formula thus 20 Simple Moving Average use Bollinger Band as a middle
Band.
Calculation of Bollinger Band:


For your information, Bollinger Band (20,2) is build in the setup by Jhon Bollinger. But it’s not
mandatory to set up used by a build. You must change as your choice. But you have to
remember that most of the traders use Bollinger Band as a build setup, for that reason its show
buy or signal similarly for most of the traders. If you want to change the build-in setup, at first you
have to be a specialist in Bollinger Band strategies. Otherwise, you have a chance more to hit stop
loss. As on the earnmoneyfx.com research team suggest you to always be with the crowd.
As per the suggestion of John Bollinger,
When simple moving average and standard deviation value is 20, You can set the standard
deviation multiplier 2
When simple moving average and standard deviation value is 50,You can set standard
deviation multiplier 2.1
When simple moving average and standard deviation value is 10, You can set the standard
deviation multiplier 1.9
How to set up Bollinger Band in Metatrader4:
Open Metatrader4> Insert >Indicator> Trend >Bollinger Band
Double Golden cross and Double Death cross:
Double Golden cross and Double Death cross are crossing above or below of three moving
averages. Before deep drive it at first we have to know what Moving Averages is and how
Moving averages are structured. Let’s check …..
Various types of Moving Average we saw in the technical analysis world. E.g. Simple Moving
Average (SMA), Exponential Moving Average (EMA), Smoothed Moving Average (SMMA)
etc.
Simple Moving Average (SMA) and Exponential Moving Average (EMA) are most of the time
used this strategy because of it’s easy to calculate and understand.
Definition and Calculation of Simple Moving Average (SMA):
A simple moving average is formed by calculating the average price of a currency
over a specific number of periods.
Most moving averages are based on closing prices; for example, a 5-day simple moving
average is the five-day sum of closing prices which divided by five.
As its name implies, a moving average is an average that moves.
Old data generally dropped when new data becomes available, causing the average to move
along the time scale.
The example below shows a 5-day moving average evolving over three days.
- Daily Closing Prices: 11,11,13,14,15,15,17
- Second day of 5-day SMA: (11 + 13 + 14 + 15 + 16) / 5 = 14
The first-day moving average covers the last five days.
The second day of the moving average drops the first data point (11) and adds the new
data point (15).
The third day of the moving average continues by dropping the first data point (11) and
adding the new data point (17).
In the example above, prices gradually increase from 11 to 17 over a total of seven days.
Notice that the moving average also rises from 13 to 15 over a three-day calculation period.
Also, each moving average value is just below the list price. For example, the moving
average for day one equals 13 and the last price is 15. Prices the prior four days were lower
and this causes the moving average to lag.
For your kind information, Any type of moving average strategy is a trend trading system.
Moving Average works well when prices are trending.
In a choppy or sideways market moving average strategies are unable to support accurately.
So we must avoid using moving average strategies when markets are situated in choppy or
sideways.
Otherwise, it’s a great chance to hit stop loss easily.
Simple Moving Average is set by default indicator in Metatrader4 or Metatrader5.
Metatrader4 Simple Moving Average plot as below
Open Metatrader4 >Insert >Indicator >Trend >Moving Average>Simple >OK
Important things,
We will take our BUY position when the price is above 200 Simple Moving Average.
Also, We will take our SELL position when the price is below the 200 Simple Moving Average.
What is Exponential Moving Average (EMA)?
An exponential moving average (EMA) is a type of moving average (MA) that places a greater weight
and the significance of the most recent data.
The exponential moving average is also referred to as the exponentially weighted moving
average.
An exponentially weighted moving average reacts more significantly to recent price
changes rather than a simple moving average (SMA), which applies an equal weight to all
observations in the period.
Shortcut calculation of Exponential Moving Average (EMA):
Exponential Moving Average (EMA) = Price (T) X K + EMA (Y) X (1-k)
Where,
T= Today
Y= Yesterday
N= Number of Day in Exponential Moving Average
K= 2 / (N+1)
Don’t be silly about Exponential Moving Average critical calculation.
Exponential Moving Average is set by default indicator in Metatrader4 or Metatrader5.
Metatrader4 Exponential Moving Average plot as below
Open Metatrader4 >Insert >Indicator >Trend >Moving Average>Exponential >OK
Important things,
We will take our BUY position when the price is above 200 Exponential Moving Average.
Also, we will take our SELL position when the price is below 200 Exponential Moving Average.
Double Golden Cross Entry-Exit Strategy:
Before learning Double Golden Cross Entry-Exit Strategy at first we have to know what is
Double Golden Cross.
What is Double Golden Cross: Sudden time world heavyweight news channel or
newspaper (e.g. BBC, CNN, and BLOOMBERG) published breaking news that AUDUSD
created Golden Cross. After this news market tries to create a new higher high. It’s
specially BUY mood because of Golden Cross psychology.
Actually when Short term Moving Average and Midterm Moving Average crosses Long
Term Moving Averages from below there aftermarket create Double Golden Cross.
As very much simple, When 50 Simple Moving Average and 200 Simple Moving Average
crosses 200 Simple Moving Average from below that is Double Golden Cross. You also can
use Exponential Moving Average here as like as Exponential Moving Average.
Image 1: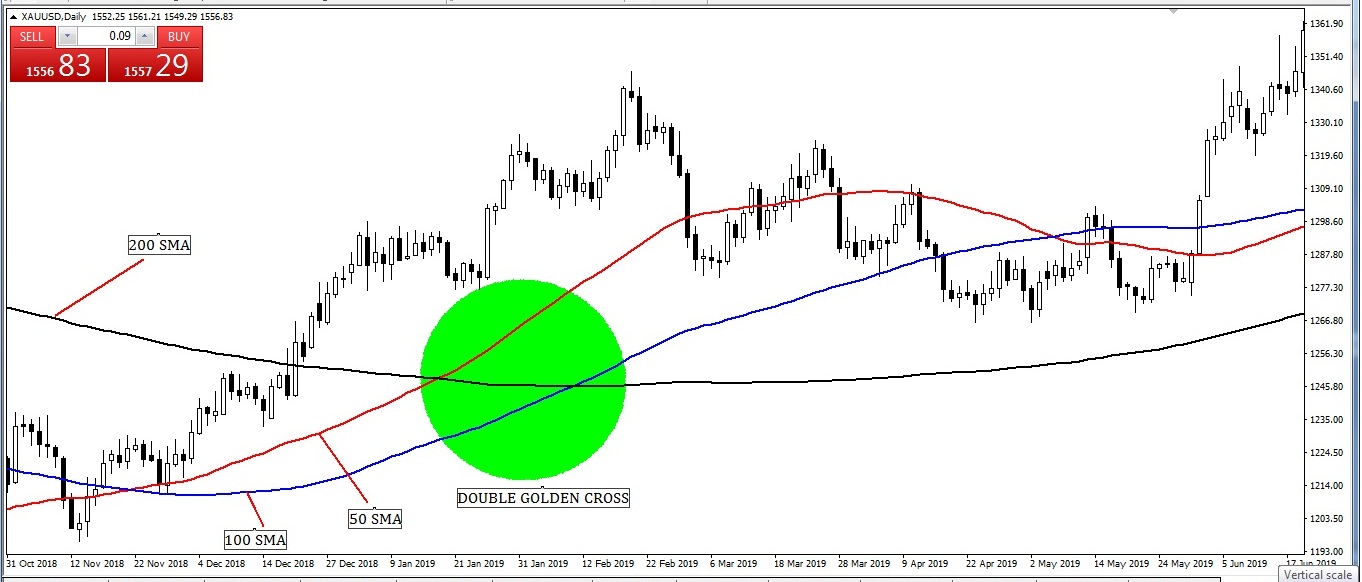
Double Golden Cross (From below 50 Simple Moving Average and 100
Simple Moving Average crossed 200 Simple Moving Average)
A lot of types of Double Golden Cross with Bollinger Band Entry and Exit Strategy are
practicing in the financial market.
Earnmoneyfx.com research team suggest you two most usable strategies which success
rate is eighty to ninety percent when you follow our instructions properly.
Those are
1. Aggressive Entry and Exit Strategy when Golden Cross and Double Golden Cross
With Bollinger Band.
2. Traders Action Zone (TAZ) Entry and Exit Strategy With Bollinger Band.
Let’s discover both…..
Image 2: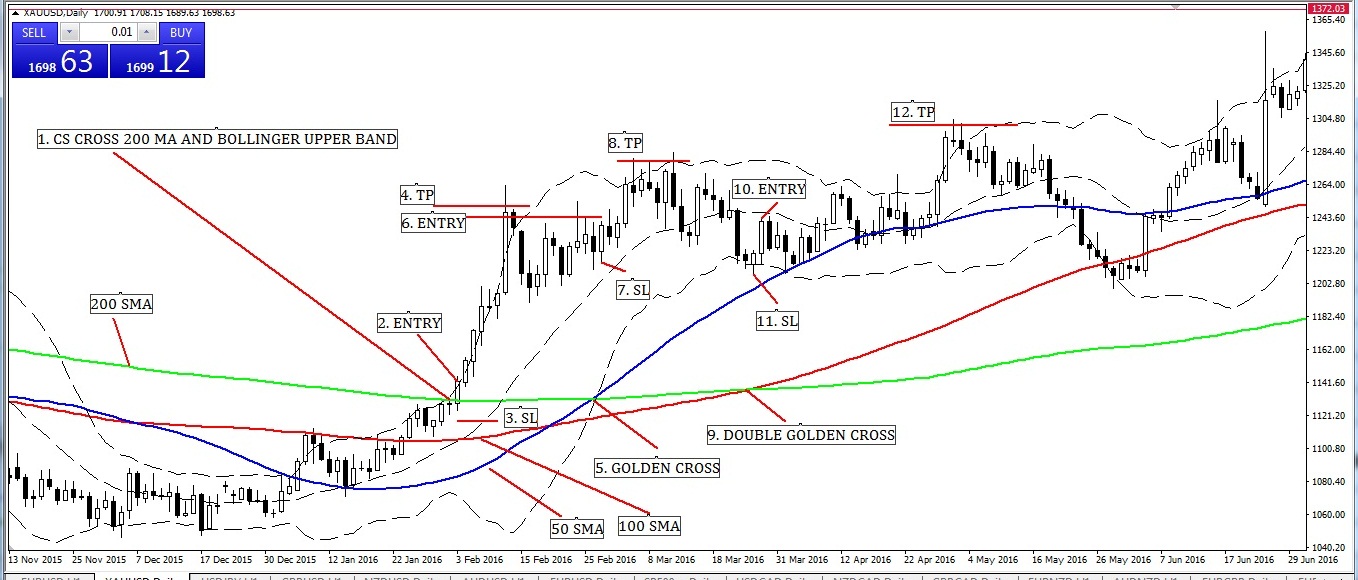
Aggressive Entry and Exit Strategy when Bollinger Upper Band Cross, Golden
Cross and Double Golden Cross.
Image point number – 1, Candlesticks close above 200 Moving Average. Also close above
or breakout Bollinger Upper Band. That means its uptrend is confirmed.
Image point number – 2, Though this strategy is a combo strategy with Bollinger band and
double golden cross, So it’s time, take entry as an aggressive trader. Here one thing is most
important that if you are a conservative or pull-back trader, you will avoid this entry.
Because discipline is key to success in forex. So we must be disciplined as on trading style.
Put BUY STOP order 2 pips above by aggressive trader on 200 Moving Average and
Bollinger Upper Band breakout candlesticks.
Image point number – 3, Hit BUY STOP order STOP LOSS place 2 pips below of entry CS by the aggressive trader.
Image point number – 4, Near swing high or 1: 2 or 1 : 3 risk-reward ratio place by
the conservative trader.
Image point number – 5, Wow TP hit. It’s celebrating time. Also time to watch when
golden cross happened.
At last golden crossed.
Image point number – 6, After golden crossed put BUY STOP order 2 pips above by
aggressive or conservative trader on golden crossed candlesticks.
Image point number – 7, Hit BUY STOP order STOP LOSS place 2 pips below of entry CS
by the aggressive or conservative trader.
Image point number – 8, Near swing high or 1:2 or 1 : 3 risk-reward ratio place by
conservative trader.
Image point number – 9, Wow again TP hit. It’s again celebrating time. Because of
the continuing process through this strategy we have no time to leisure thus now we have to
watch when a double golden cross happened.
Hurrah double golden crossed.
Image point number – 10, After double golden crossed put BUY STOP order 2 pips above
by aggressive or conservative trader on golden crossed candlesticks.
Image point number – 11, Hit BUY STOP order STOP LOSS place 2 pips below of entry CS
by the aggressive or conservative trader.
Image point number – 12, Near swing high or 1:2 or 1 : 3 risk-reward ratio place by
conservative trader.
Image 3:
Traders Action Zone (TAZ) Entry and Exit Strategy.
What is Traders Action Zone (TAZ): Before entering the deepest part of this strategy, It will
be wise if we try to know what is Traders Action Zone (TAZ).
Traders Action Zone (TAZ) is actually this area of the chart where swing traders and pullback
traders always focus on their eyes and take their position. Until price come back Traders
Action Zone (TAZ), Swing trader, and pullback trader must wait for entry.
Various strategies designed various types of Traders Action Zone (TAZ) areas.
This Golden Cross strategy Traders Action Zone (TAZ) is between 50 Simple Moving
Average and 200 Simple Moving Average till setup valid.
Let’s extract….
Image point number – 1, Candlesticks close above 200 Moving Average which identifies its
uptrend. Also, time to watch a movie or read the book till getting a valid signal as per Traders
Action Zone (TAZ) Entry and Exit Strategy.
After the Golden Cross price massively goes up. But as per Traders Action Zone (TAZ) Entry
and Exit Strategy we have to continue watching movies or reading books until price come
back Traders Action Zone (TAZ).
Image point number – 2, Also after Double Golden Cross price massively goes up. But as
per Traders Action Zone (TAZ) Entry and Exit Strategy we have to continue watching
movie or reading the book until the price comes back Traders Action Zone (TAZ).
Image point number – 3, Price comes back in Traders Action Zone (TAZ) thus stop
watching movie or reading book. It’s trading time. Be concentrate market and find bullish
price action reversal candlesticks pattern (PIN BAR, BULLISH ENGULFING, MORNING
STAR, HAMMER, HARAMI, PIERCING, DOJI, etc.)
After finding bullish price action reversal candlesticks pattern put BUY STOP order 2 pips
above by aggressive or conservative trader on that candlesticks.
Image point number – 4, Hit BUY STOP order STOP LOSS place 2 pips below of entry CS
by the aggressive or conservative trader.
Image point number – 5, Near swing high or 1:2 or 1 : 3 risk-reward ratio place by
conservative trader.
Double Death Cross Entry-Exit Strategy:
Before learning Double Death Cross Entry-Exit Strategy at first we have to know what is
Double Golden Cross.
What is Double Death Cross: Sudden time world heavyweight news channel or
newspaper (e.g. BBC, CNN, and BLOOMBERG) published breaking news that NZDUSD
created Death Cross. After this news market tries to create a new Lower low. It’s especially
SELL mood because of Death Cross psychology.
Actually when Short term Moving Average and Midterm Moving Average crosses Long
Term Moving Averages from above their aftermarket create Double Death Cross.
As very much simple, When 50 Simple Moving Average and 200 Simple Moving Average
crosses 200 Simple Moving Average from above that is Double Death Cross. You also can
use Exponential Moving Average here as like as Exponential Moving Average.
A lot of types of Double Death Cross with Bollinger Band Entry and Exit Strategy are
practicing in the financial market.
Earnmoneyfx.com research team suggest you two most usable strategies which success
rate is eighty to ninety percent when you follow our instructions properly.
Those are
1. Aggressive Entry and Exit Strategy when Golden Cross and Double Death Cross With
Bollinger Band.
2. Traders Action Zone (TAZ) Entry and Exit Strategy With Bollinger Band.
Let’s discover both…..
Image 4: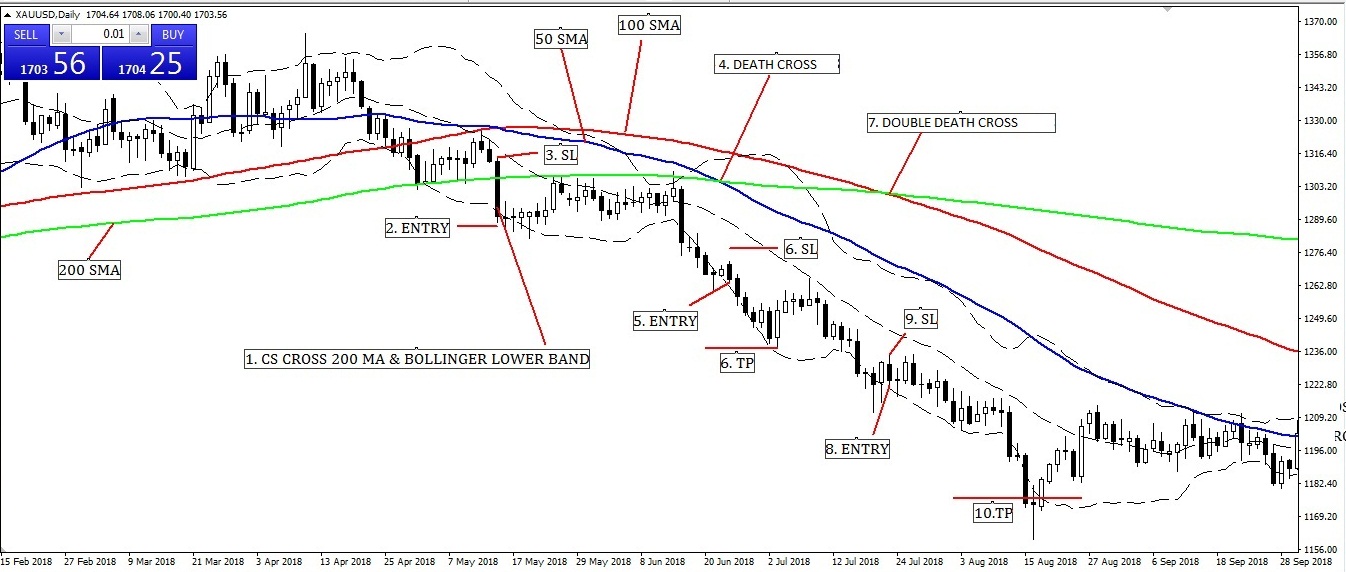
Aggressive Entry and Exit Strategy when Bollinger Lower Band Cross, Death
Cross and Double Death Cross.
Image point number – 1, Candlesticks close below 200 Moving Average. Also, close below
or breakout Bollinger Lower Band. That means its downtrend is confirmed.
Image point number – 2, Though this strategy is a combo strategy with Bollinger band and
double golden cross, So it’s time, take entry as an aggressive trader. Here one thing is most
important that if you are a conservative or pull-back trader, you will avoid this entry.
Because discipline is the key to success in forex. So we must be disciplined as on trading
style.
Put SELL STOP order 2 pips below by aggressive trader on 200 Moving Average and
Bollinger Lower Band breakout candlesticks.
Image point number – 3, Hit SELL STOP order STOP LOSS place 2 pips above of entry CS
by the aggressive trader.
Image point number – 4, Near swing low or 1: 2 or 1 : 3 risk-reward ratio place by
conservative trader.
Image point number – 5, Wow TP hit. It’s celebrating time. Also, time to watch when death
crosses happened.
At last, death crossed.
Image point number – 6, After death crossed put SELL STOP order 2 pips below by
an aggressive or conservative trader on death-crossed candlesticks.
Image point number – 7, Hit SELL STOP order STOP LOSS place 2 pips above of entry CS
by the aggressive or conservative trader.
Image point number – 8, Near swing low or 1:2 or 1 : 3 risk-reward ratio place by
conservative trader.
Image point number – 9, Wow again TP hit. It’s again celebrating time. Because of
the continuing process through this strategy we have no time to leisure thus now we have to
watch when a double death cross happened.
Hurrah double death crossed.
Image point number – 10, After double golden crossed put SELL STOP order 2 pips below
by an aggressive or conservative trader on death-crossed candlesticks.
Image point number – 11, Hit SELL STOP order STOP LOSS place 2 pips above of entry CS
by the aggressive or conservative trader.
Image point number – 12, Near swing low or 1:2 or 1 : 3 risk-reward ratio place by
conservative trader.
Image 5: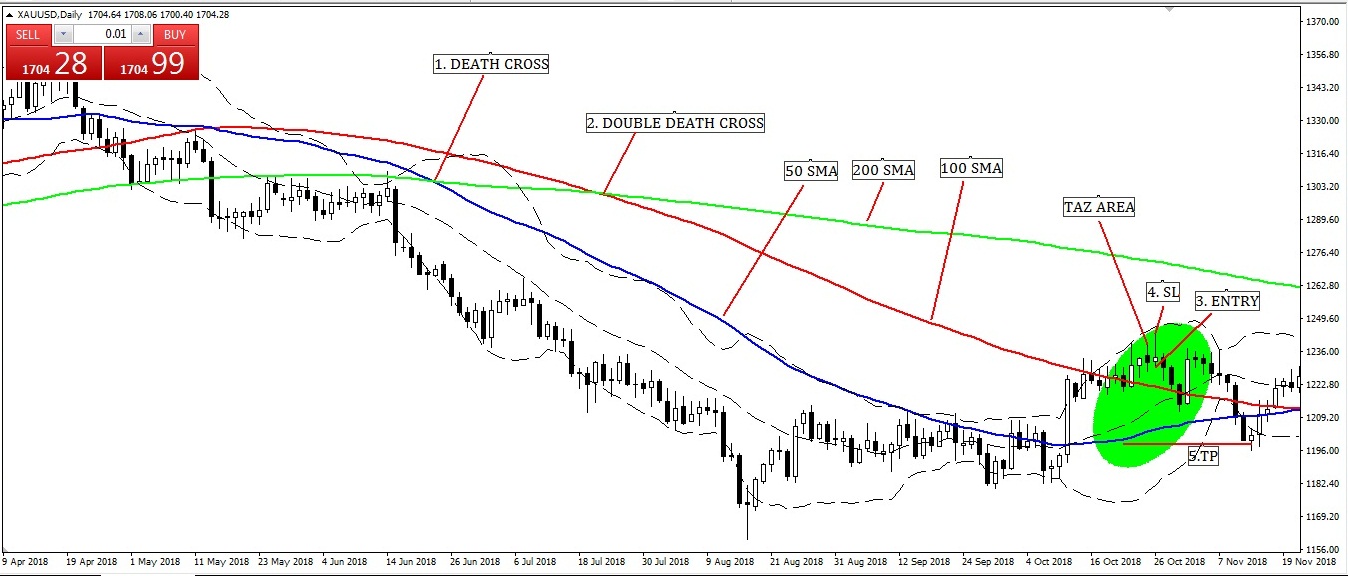
Traders Action Zone (TAZ) Entry and Exit Strategy.
What is Traders Action Zone (TAZ): Before entering the deepest part of this strategy, It will
be wise if we try to know what is Traders Action Zone (TAZ).
Traders Action Zone (TAZ) is actually this area of the chart where swing trader and pullback
trader always focus on their eyes and take their position. Until price come back Traders
Action Zone (TAZ), Swing trader, and pullback trader must wait for entry.
A various strategy designed various type of Traders Action Zone (TAZ) area.
This Golden Cross strategy Traders Action Zone (TAZ) is between 50 Simple Moving
Average and 200 Simple Moving Average till setup valid.
Let’s extract….
Image point number – 1, Candlesticks close below 200 Moving Average which identifies its
downtrend. Also, time to watch a movie or read book till getting a valid signal as per Traders
Action Zone (TAZ) Entry and Exit Strategy.
After Death Cross price massively goes down. But as per Traders Action Zone (TAZ) Entry
and Exit Strategy we have to continue watching movies or reading book until price come
back Traders Action Zone (TAZ).
Image point number – 2, Also after Double Death Cross price massively goes down. But as
per Traders Action Zone (TAZ) Entry and Exit Strategy we have to continue watching
movie or reading book until price comes back Traders Action Zone (TAZ).
Image point number – 3, Price comes back in Traders Action Zone (TAZ) thus stop
watching movie or reading books. It’s trading time. Be concentrate market and find bearish
price action reversal candlesticks pattern (PIN BAR, BEARISH ENGULFING, SHOOTING
STAR, HARAMI, DARK CLOUD COVER, DOJI, etc.)
After finding bearish price action reversal candlesticks pattern put SELL STOP order 2 pips
below by an aggressive or conservative trader on that candlesticks.
Image point number – 4, Hit SELL STOP order STOP LOSS place 2 pips above of entry CS
by the aggressive or conservative trader.
Image point number – 5, Near swing low or 1:2 or 1 : 3 risk-reward ratio place by
a conservative trader.
——- Thanks for giving us your valuable time to read this article ——–
(To be continued)


