Earn Money Forex Best Forex Trading Experience


Friends……. Thanks a lot for visit earnmoneyfx.com
earnmoneyfx.com research team suggest Bollinger Band Entry-Exit strategies as below,
1. Candlesticks Pattern with Bollinger Band
2. Double Top Chart Pattern with Bollinger Band
3. Double Bottom Chart Pattern with Bollinger Band
4. Reversal or Counter Candlesticks with Bollinger Band
5. Trend line Breakout with Bollinger Band
6. Swing Trading with Middle Band (20 Simple Moving Average) Bollinger Band
7. 200 Simple Moving Average with Bollinger Band
8. Walking with Bollinger Band etc.
Bollinger Band Entry-Exit Strategy (Part -1) we have discussed Candlesticks
Pattern with Bollinger Band and Double Top Chart Pattern with Bollinger Band.
Bollinger Band Entry-Exit Strategy (Part -2) we have discussed Double Bottom
Chart Pattern with Bollinger Band and Reversal or Counter Candlesticks with
Bollinger Band.
If you missed both of all or any one, Earnest request you to visit Bollinger Band Entry-Exit
Strategy (Part -1) and Bollinger Band Entry-Exit Strategy (Part -2) in earnmoneyfx.com
This article earnmoneyfx.com research teams try to cover other strategies as below.
*** Trend line Breakout with Bollinger Band
Let’s explore ……….
Trend line Break with Bollinger Brand Entry-Exit Strategy :
Before exploring Trend line Break with Bollinger Brand Entry-Exit Strategy at first we
learn to know what is Trend Line and How to draw trend lines properly.
What is Trend Line: In the world of FOREX, STOCK and COMMODITIES market, There is the most common sentence we heard,
TREND IS FRIEND
It is absolutely right. FOREX, STOCK, and COMMODITIES market are always either uptrend /
downtrend or sideways.
It will be easy to earn from FOREX, STOCK, and COMMODITIES market if you identify trends
properly. Whatever its uptrend or downtrend.
TREND LINE is one of the major tools to identify trends.
As per Investopedia, the Trend line is a line that draws over pivot highs or under pivot lows
which shows the prevailing direction of price. That means,
When the price is an uptrend, the trend line draws under pivot low.
When the price is a downtrend, the trend line draws over pivot high.
For your information,
Few traders connect the trend line with the swing low when drawing an uptrend trend line.
Few traders connect the trend line with the swing high when drawing a downtrend trend line.
Few traders want to avoid only connecting the trend line with the swing low, they try to connect
most of the candlesticks low when drawing an uptrend trend line.
Few traders want to avoid only connecting the trend line with the swing high, they try to connect
most of the candlesticks are high when drawing a downtrend trend line.
Few traders avoid Japanese candlesticks, they only use line charts when drawing trend lines.
Are u confused!!
I am sure you are confused. You want to know which way is best to the draw trend line.
There is nothing to worry.
earnmoneyfx.com research team suggest that you can draw a trend line anyway but
you have to be sure that you connect two or more swing point.
Here two or more swing point connection is very very important. Two or more candlesticks
connect is not important. You can connect more candlesticks for a strong trend line.
Let’s enjoy how to enter and exit the trend line break with the Bollinger band.
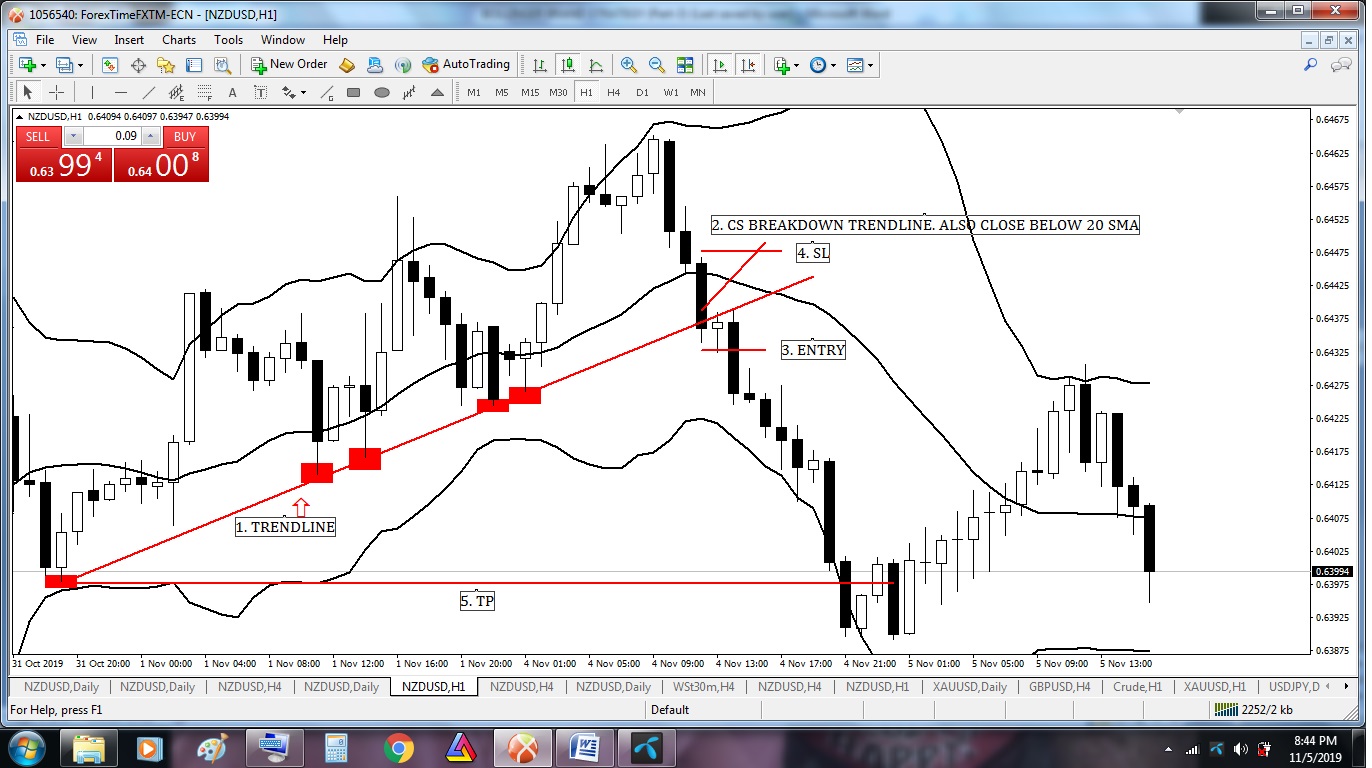
Same Time Bollinger Middle Band and Trend Line Break Entry-Exit Strategy
Image point number – 1, We see a strong uptrend of price with Bollinger Upper Brand
touches and few swings. As per trend line rules, we draw a trend line here to connect two
more swing lows. Also, we connect here four to five candlesticks low which show a strong
trend line.
Image point number – 2, Candlesticks break down trend line. Also, candlesticks close
below Bollinger Middle Band. As per rules of the same time Bollinger Middle Band and Trend
Line break Entry-Exit Strategy, This candlestick is our entry candlesticks.
Image point number – 3, Aggressive or conservative trader put their SELL STOP order 2
pips below of the Bollinger Middle Band and trend line break down candlesticks.
Image point number – 4, After hit SELL STOP order aggressive or conservative trader
place STOP LOSS 2 pips above of Bollinger Middle Band and trend line break down
candlesticks. Few traders place STOP LOSS 2 pips above of Bollinger Middle Band.
Image point number – 5, Conservative or aggressive trader place their take profit level on
the near swing low or 1: 2 or 1 : 3 risk-reward ratio.
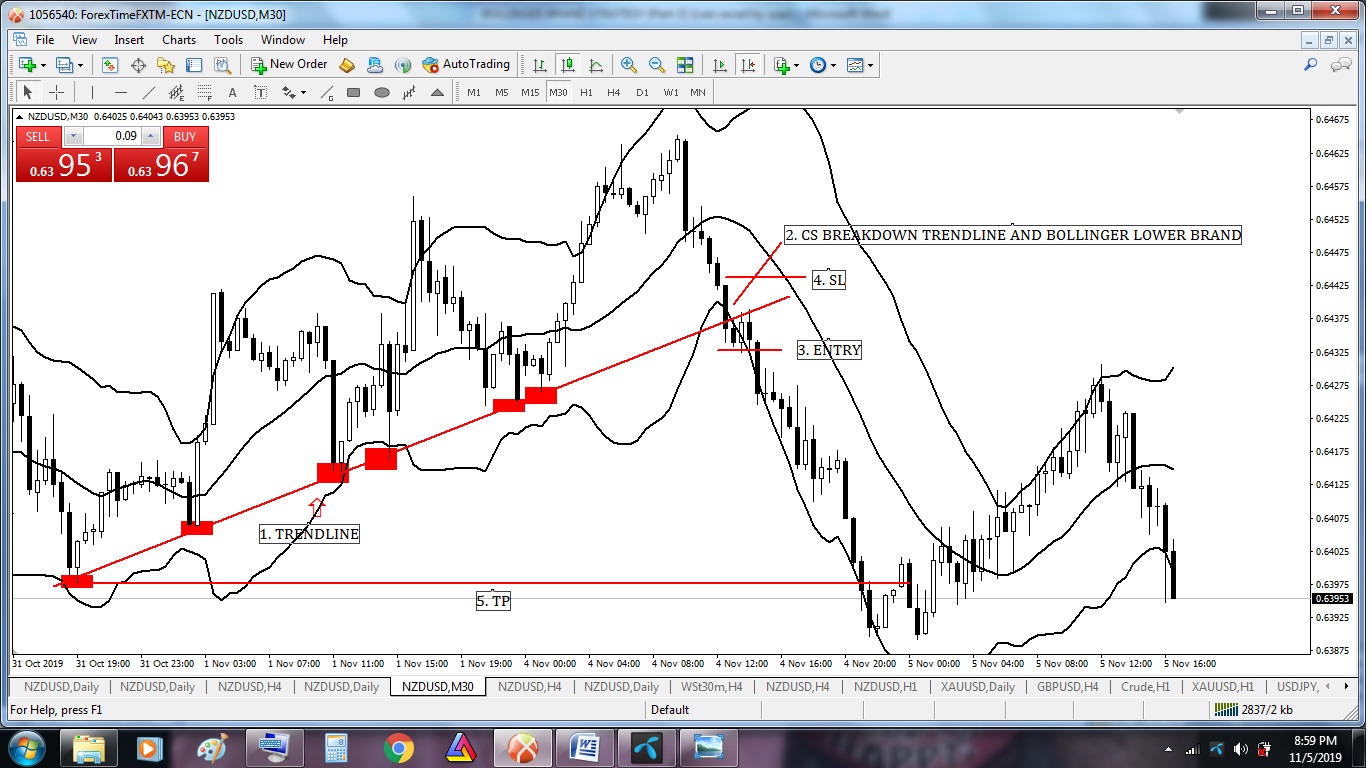
Same Time Bollinger Lower Band and Trend Line Break down Entry-Exit
Strategy
Image point number – 1, We see a strong uptrend of price with Bollinger Upper Brand
touches and few swings. As per trend line rules, we draw a trend line here to connect two
more swing lows. Also, we connect here five more candlesticks low which show a strong trend
line.
Image point number – 2, Candlesticks break down trend line. Also, candlesticks break
down below Bollinger Lower Brand at the same time. As per rules of the same time Bollinger Lower
Brand and Trend Line break down Entry-Exit Strategy, This candlestick is our entry
candlesticks.
Image point number – 3, Aggressive or conservative trader put their SELL STOP order 2
pips below of the Bollinger Lower Band and trend line break down candlesticks.
Image point number – 4, After hit SELL STOP order aggressive or conservative trader
place STOP LOSS 2 pips above of Bollinger Middle Band and trend line break down
candlesticks. Few traders place STOP LOSS 2 pips above of Bollinger Middle Band.
Image point number – 5, Conservative or aggressive trader place their take profit level on
the near swing low or 1: 2 or 1 : 3 risk-reward ratio.
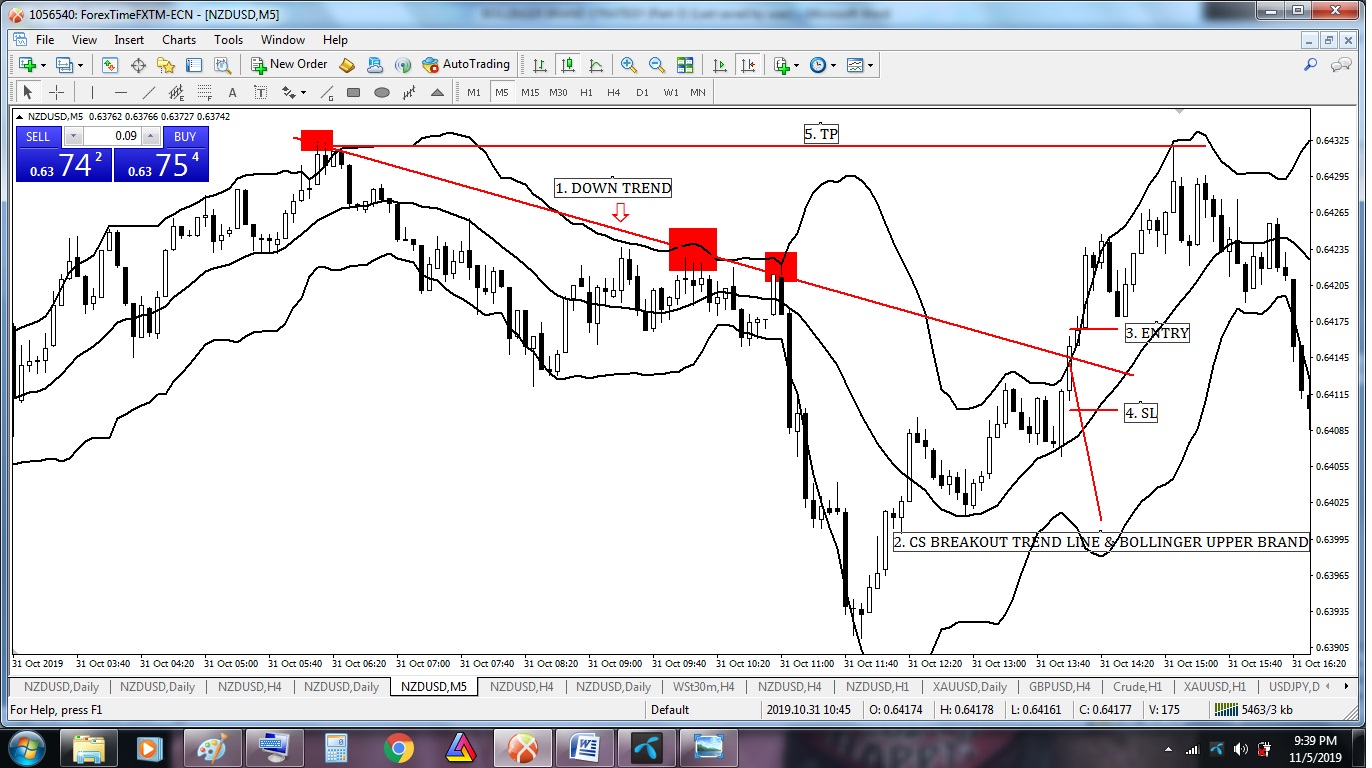
Same Time Bollinger Upper Brand and Trend Line Break out Entry-Exit
Strategy
Image point number – 1, We see a strong downtrend of price with Bollinger Lower Band
touches and few swings. As per trend line rules, we draw a trend line here to connect two
more swings high. Also, we connect here five more candlesticks high which show a strong
trend line.
Image point number – 2, Candlesticks break out trend line. Also, candlesticks break out
below Bollinger Upper Band same time. As per rules of the same time Bollinger Upper Band
and Trend Line break down Entry-Exit Strategy, This candlestick is our entry candlesticks.
Image point number – 3, Aggressive or conservative trader put their BUY STOP order 2
pips above of the Bollinger Upper Band and trend line break out candlesticks.
Image point number – 4, After hit BUY STOP order aggressive or conservative trader
place STOP LOSS 2 pips below of Bollinger Upper Band and trend line break out
candlesticks. Few traders place STOP LOSS 2 pips below of Bollinger Middle Band.
Image point number – 5, Conservative or aggressive trader place their take profit level on
near swing High or 1: 2 or 1 : 3 risk-reward ratio.
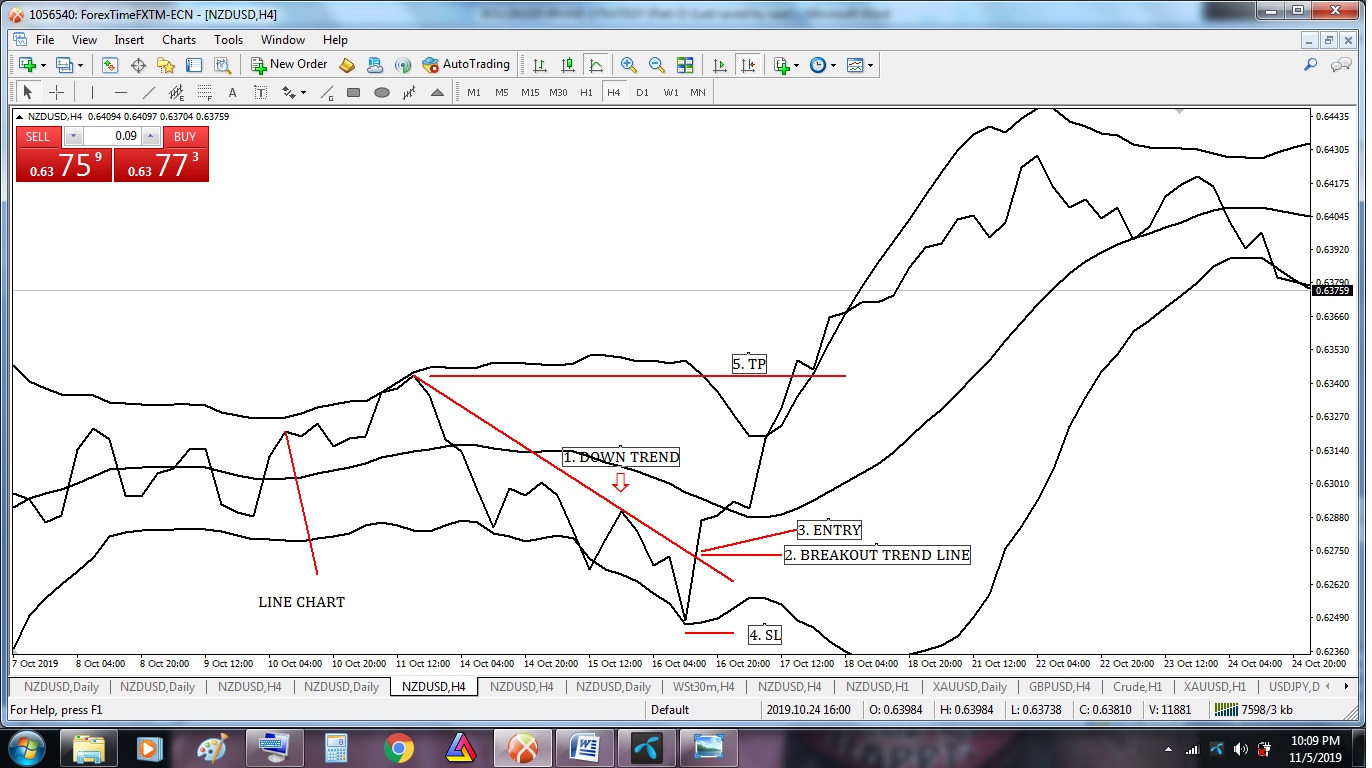
Line Chart Trend Line Break out with Bollinger Band Entry-Exit Strategy
Image point number – 1, We see a strong downtrend of price with Bollinger Lower Band
touches and few swings. As per trend line rules, we draw a trend line here to connect two
more swings high.
Image point number – 2, Price break out trend line. As per rules of Line Chart Trend Line
Break out with Bollinger Brand Entry-Exit Strategy, It’s time to enter.
Image point number – 3, Aggressive or conservative trader put their BUY STOP order 2
pips above of trend line.
Image point number – 4, After hit BUY STOP order aggressive or conservative trader
place STOP LOSS 2 pips below of swing low.
Image point number – 5, Conservative or aggressive trader place their take profit level on
near swing High or 1: 2 or 1 : 3 risk-reward ratio.
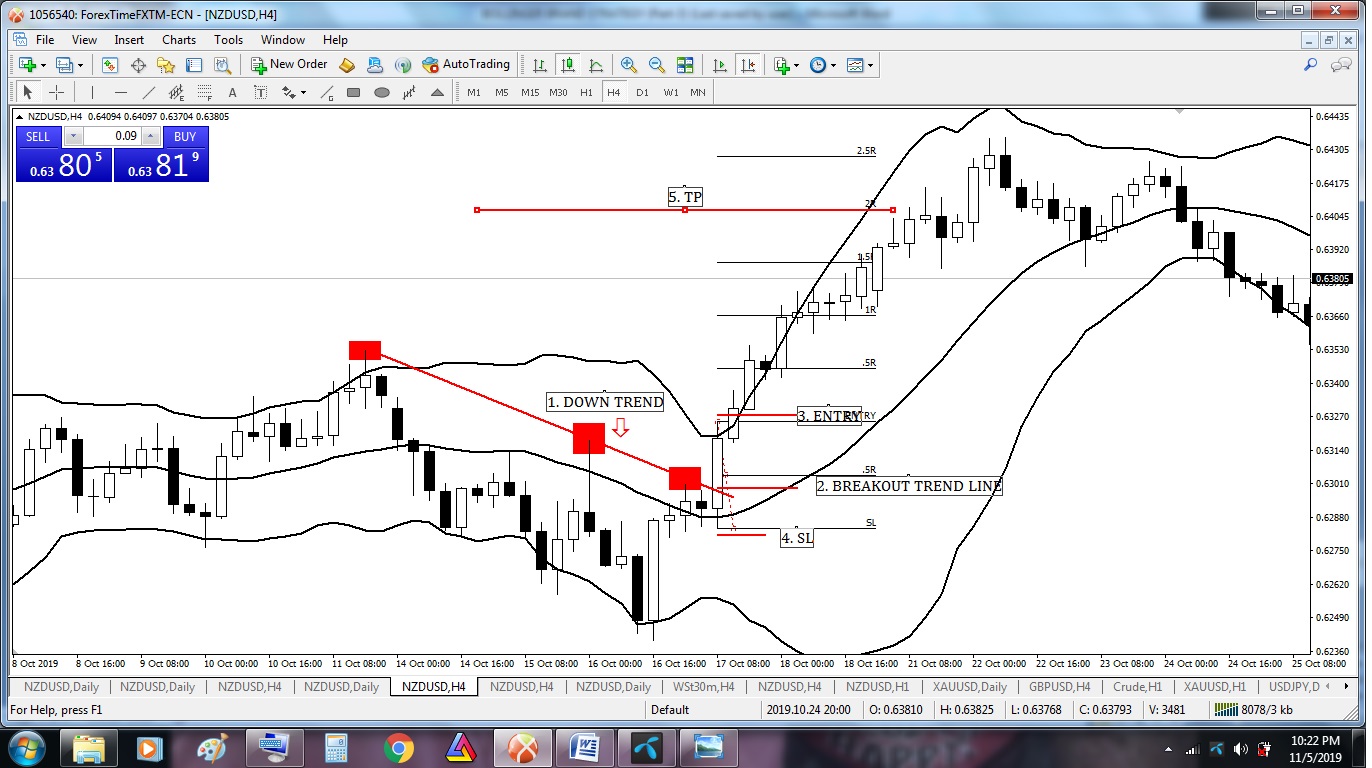
Trend Line Break out with Bollinger Band Entry-Exit Strategy
Image point number – 1, We see a strong downtrend of price with Bollinger Lower Band
touches and few swings. As per trend line rules, we draw a trend line here by connecting two
swings high. Also, we connect here three more candlesticks high which show a strong trend
line.
Image point number – 2, Candlesticks break out trend line. As per the rules of Trend Line
break out with Bollinger Band Entry-Exit Strategy, This candlestick is our entry
candlesticks.
Image point number – 3, Aggressive or conservative trader put their BUY STOP order 2
pips above of the trend line break out candlesticks.
Image point number – 4, After hit BUY STOP order aggressive or conservative trader
place STOP LOSS 2 pips below of trend line break out candlesticks.
Image point number – 5, Conservative or aggressive traders place their take profit level on
the near swing high or 1: 2 or 1 : 3 risk-reward ratio.
Bollinger Brand Strategies get profit (Part-4) click here
——- Thanks for giving your valuable time to read this article ——–
(To be continued)