 Earn Money Forex Best Forex Trading Experience

200 Moving Average Strategies. (Part -8)
Friends……….
earnmoneyfx.com team gives you a lot of thanks for the visit here.
There are various types of 200 Moving Average Strategy. We (earnmoneyfx.com
research team) forward below strategy to follow as a 200 Simple Moving Average entry
exit strategies.
1. Support & Resistance
2. 200 MA Bounce
3. Trend line
4. Ascending Triangle
5. Descending Triangle
6. Symmetrical Triangle
7. Flag Pattern
8. Channel
9. Candlesticks Pattern
10. Golden Cross
11. Death Cross
12. Double Golden Cross
13. Double Death Cross
14. Short term & Midterm moving average cross
15. Multi time frame analysis.
It’s your kind information that explored all strategies that are fully tested by demo. The maximum
time success ratio was sixty to seventy-five percent.
If you follow our strategy, Its earnest request you to follow earnmoneyfx.com research
team suggestion properly.
There is no doubt that if you follow earnmoneyfx.com research team suggestion properly
when entry and exit, your trading result must better day by day.
(EURUSD, GBPUSD, AUDUSD, NZDUSD, USDCHF, USDCAD, USDJPY, EURJPY, GBPJPY),
XAUUSD, XAUEUR, CRUDE OIL, and S& P500 are earnmonreyfx.com research team
suggest pair and One Hourly, Four Hourly, Daily timeframe also suggest.
Part -1 of 200 Moving Average Strategy, we have discussed about the structure of 200 Moving
Average, types of 200 Moving Average and 200 Moving Average Support and
Resistance Entry-Exit Strategy in detail.
The above link is for your ready references.
Part -2 of 200 Moving Average Strategy, we have discussed about 200 Moving Average
Bounce Entry-Exit Strategy in detail.
The above link is for your ready references.
Part -3 of 200 Moving Average Strategy, we have discussed about How to Entry and Exit
Trend line and 200 Moving Average.
The above link is for your ready references.
Part -4 of 200 Moving Average Strategy, we have discussed about Ascending Triangle
with 200 Moving Average Entry-Exit Strategy, Descending Triangle with 200 Moving
Average Entry-Exit Strategy and Symmetrical Triangle with 200 Moving Average
Entry-Exit Strategy.
The above link is for your ready references.
Part -5 of 200 Moving Average Strategy,, we have discussed about Bullish flag pattern
with 200 Moving Average Entry-Exit Strategy, Bearish flag pattern with 200 Moving
Average Entry-Exit Strategy, Bullish Channel Pattern with 200 Moving Average Entry
Exit Strategy, Bearish Channel Pattern with 200 Moving Average Entry-Exit Strategy
The above link is for your ready references.
Part -6 of 200 Moving Average Strategy, we have discussed about Golden Cross Entry-Exit
Strategy, Death Cross Entry-Exit Strategy.
The above link is for your ready references.
Part -7 of 200 Moving Average Strategy, we have discussed about Double Golden Cross
Entry-Exit Strategy, Double Death Cross Entry-Exit Strategy.
The above link is for your ready references.
I hope you not miss below all. If miss please search our website earnmoneyfx.com as below
keyword.
200 Moving Average Strategy (Part -1), 200 Moving Average Strategy (Part -2), 200 Moving
Average Strategy (Part -3), 200 Moving Average Strategy (Part -4), 200 Moving Average
Strategy (Part -5), 200 Moving Average Strategy (Part -6) and 200 Moving Average Strategy
(Part -7)
As a series strategy today we (earnmoneyfx.com research teams) present last part of 200
Moving Average Strategy series. These are……
*** Multi time frame 200 Moving Average Entry-Exit Strategy ***
Let’s try to explore the last part of the 200 Moving Average Strategy series.……….
Multi time frame means various time frames use when entry and exit in forex. Before
exploring this strategy at first we have to know what is 200 Moving Average and What is
Multi time frame analysis. Let’s check below …..
Moving Average are various types. E.g. Simple Moving Average (SMA), Exponential Moving
Average (EMA), Smoothed Moving Average (SMMA), etc.
Simple Moving Average (SMA) and Exponential Moving Average (EMA) are the most uses of
this strategy because of its easy to calculate and understand.
Definition and Calculation of Moving Average (MA):
A simple moving average is formed by calculating the average price of a currency
over a specific number of periods.
Most moving averages are calculated on closing prices; for example, a 5-day simple moving
the average is the five-day sum of closing prices divided by five.
As its name implies, a moving average is an average that moves.
When new data becomes available then old data is dropped, causing the average to move
along the time scale.
The example below shows a 5-day moving average evolving over three days
\
Daily Closing Prices: 11,12,13,14,14,15,16
First day of 5-day SMA: (11 + 12 + 13 + 14 + 14) / 5 = 13
Second day of 5-day SMA: (12 + 13 + 14 + 14 + 15) / 5 = 14
The first day of the moving average covers the last five days.
The second day of the moving average drops the first data point (11) and adds the new
data point (15).
The third day of the moving average continues by dropping the first data point (12) and
adding the new data point (16).
In the example above, prices increase from 11 to 16 over a total of seven days.
Notice that the moving average also rises from 13 to 15 over a three-day calculation period.
Also, notice that each moving average value is just below the list price. For example, the
moving average for day one equals 13 and the last price is 15. Prices the prior four days
were lower and this causes the moving average to lag.
For your kind information, Any moving average strategy is a trend trading system.
Moving Average work well when the price is up to trend or downtrend.
In a choppy or sideways market moving average strategies are unable to well.
So we always avoid using moving average strategies when markets are choppy or
sideways.
Otherwise its chance to hit stop loss more and more.
Simple Moving Average is the default indicator in Metatrader4 or Metatrader5.
Metatrader4 Simple Moving Average plot as below
Open Metatrader4 >Insert >Indicator >Trend >Moving Average>Simple> OK
Important things,
We will take our BUY decision when the price is above 200 Simple Moving Average.
Also, We will take our SELL decision when the price is below the 200 Simple Moving Average.
What is Exponential Moving Average (EMA)?
An exponential moving average (EMA) is a type of moving average (MA) that places a greater weight
and the significance of the most recent data points.
The exponential moving average is also referred to as the exponentially weighted moving
average.
An exponentially weighted moving average reacts more significantly to recent price
changes than a simple moving average (SMA), which applies an equal weight to all
observations in the period.
Shortcut calculation of Exponential Moving Average (EMA):
Exponential Moving Average (EMA) = Price (T) X K + EMA (Y) X (1-k)
Where,
T= Today
Y= Yesterday
N= Number of Day in Exponential Moving Average
K= 2 / (N+1)
Don’t worry about Exponential Moving Average critical calculation.
Exponential Moving Average is the default indicator in Metatrader4 or Metatrader5.
Metatrader4 Exponential Moving Average plot as below
Open Metatrader4 >Insert >Indicator >Trend >Moving Average>Exponential> OK
Important things,
We will take our BUY decision when the price is above 200 Exponential Moving Average.
Also, we will take our SELL decision when the price is below 200 Exponential Moving Average.
Multi Time Frame Analysis:
Multi time frame analysis actually analysis of two or more time frame analysis when entry
and exit in forex, stock, commodities, and futures market. Lets explained with example.
Mahin and Imran are blossom friend. They are service holder. Also, they are trade forex,
stock, commodities, and future market for extra income.
Both friend trade mostly forex major pairs, gold, oil, and Bitcoin. Imran always try to enter
and exit the daily time frame. Vice versa M try to trade all time frames. As on weekly
analysis, Mahin and Imran both are observe that BITCOIN will cross 200 MA as soon as
possible. They also know that trend is a friend and 200 MA is the most vastly used indicator for
identifying trends.
IMAGE 1: I ENTRY
Image 1
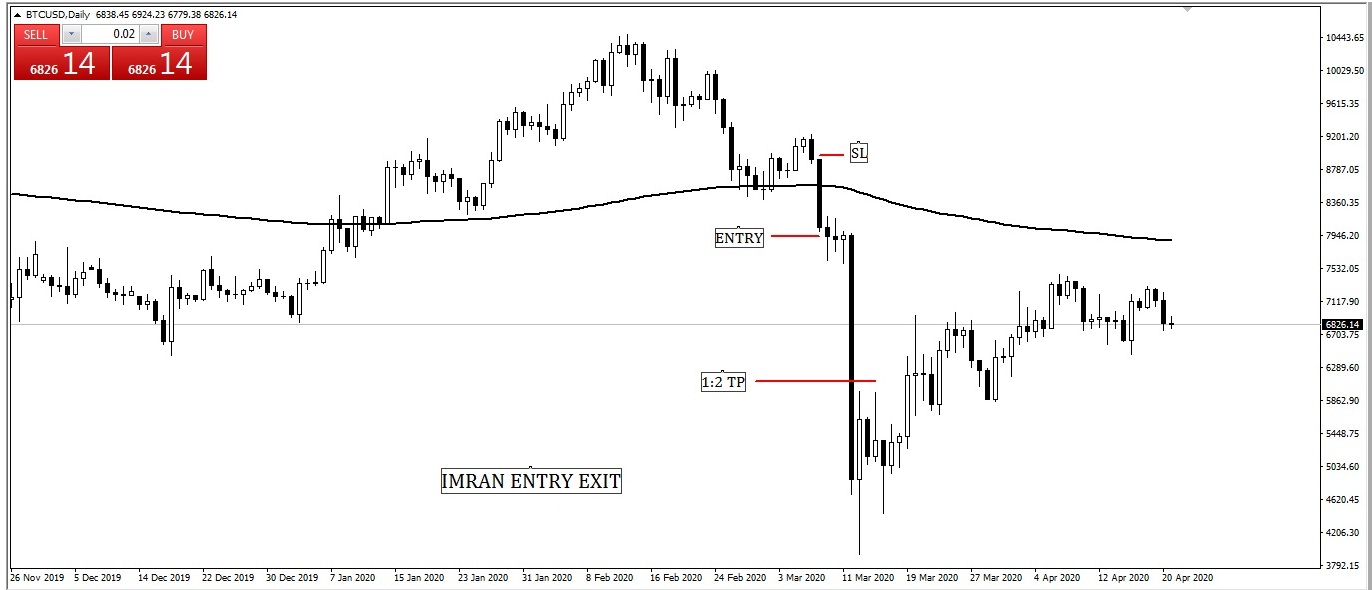
we saw Imran took his entry below 5 pips on BITCOIN when daily Bearish
Engulfing candlesticks close 200 MA. Stop Loss is 5 pips above of Bearish Engulfing
candlesticks. And take profit level is 1:2 or Swing Low, Here swing low is 1:1.7 so I
determined that he took his take profit level at 1:2. WAOOOOO……Take profit level is hit.
I feeling awesome that his trade hit 1:2
IMAGE 2: M ENTRY
Image 2
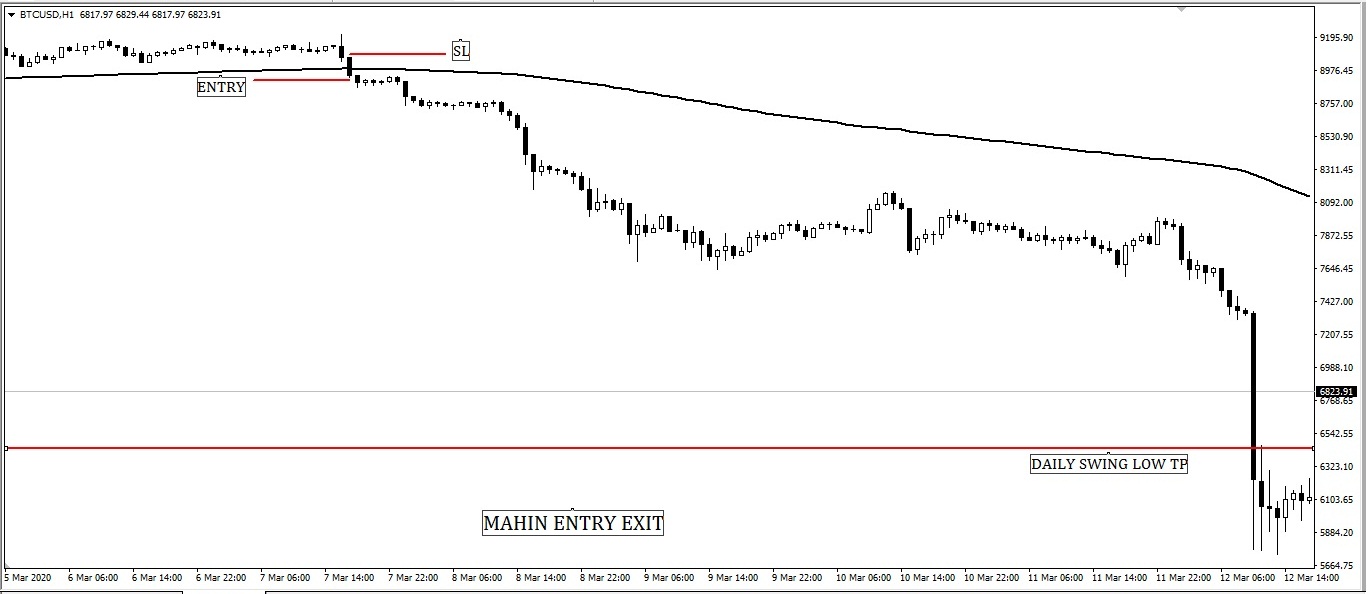
we saw M took his entry below 5 pips on BITCOIN when one hourly Bearish
Engulfing candlesticks close 200 MA. Stop Loss is 5 pips above of Bearish Engulfing
candlesticks. And take profit level is daily Swing Low.
Before entry, one hourly M watched Daily chart and he understands that BITCOIN will
cross daily 200 MA immediately. Then he switched one hour chart and wait for candlesticks
cross 200 MA. Here swing low is 1:17 so MAHIN determined that he took his take profit
level on swing low. WAOOOOO……Take profit level is hit.
MAHIN feeling awesome that his trade hit 1:17
This is the power of MULTI TIME FRAME analysis………where same entry and exit strategy
M earn more than 15 times of I.
Below here a simple technique for you…..
If you are day trader, Identify trend on H1 then entry on M15.
If you are swing trader, Identify trend on D1 then entry on H1.
If you are position trader, Identify trend on W1 then entry on D1.
Here D1 is Daily Candlesticks, H1 is One Hour Candlesticks, M15 is 15 Minute candlesticks
and W1 is weekly candlesticks.
Multi time frame 200 Moving Average Entry-Exit Strategy :
Below rules, you can follow when you adopt Multi time frame 200 Moving
Average Buy Entry-Exit Strategy (As a Swing Trader):
Rules 1: Watch Candlestick’s position. If candlesticks cross daily 200 Moving
Average from below then switched one hour chart.
Rules 2: Watch a one-hour candlesticks pattern. Is it cross 200 Moving Average. If
yes try to identify candlesticks pattern. Engulfing, Doji is best candlesticks
pattern when 200 Moving Average crossing or retest.
Rules 3: Buy Stop place two to five pips above of identified candlesticks. Also,
place stop-loss two to five pips below of identified candlesticks. Set take profit
level on the daily swing high or 1:2, 1:3 risk-reward ratio on the daily time frame.
Below rules, you can follow when you adopt Multi time frame 200 Moving
Average Sell Entry-Exit Strategy (As a Swing Trader):
Rules 1: Watch Candlestick’s position. If candlesticks cross daily 200 Moving
Average from above then switched one hour chart.
Rules 2: Watch a one-hour candlesticks pattern. Is it cross 200 Moving Average. If
yes try to identify candlesticks pattern. Engulfing, Doji is the best candlesticks
pattern when 200 Moving Average crossing or retest.
Rules 3: Sell Stop place two to five pips below of identified candlesticks. Also,
place stop-loss two to five pips above of identified candlesticks. Set take profit
level on the daily swing low or 1:2, 1:3 risk-reward ratio on a daily time frame.
Below rules, you can follow when you adopt Multi time frame 200 Moving
Average Buy Entry-Exit Strategy (As a Day Trader):
Rules 1: Watch Candlesticks’ position. If candlesticks cross one hourly 200
Moving Average from below then switched fifteen-minute chart.
Rules 2: Watch Fifteen Minute candlesticks pattern. Is it cross 200 Moving
Average. If yes try to identify candlesticks pattern. Engulfing, Doji is the best
candlesticks pattern when 200 Moving Average crossing or retest.
Rules 3: Buy Stop place two to five pips above of identified candlesticks. Also,
place stop-loss two to five pips below of identified candlesticks. Set take profit
level on one hour swing high or 1:2, 1:3 risk-reward ratio on the one-hour time
frame.
Below rules, you can follow when you adopt Multi time frame 200 Moving
Average Sell Entry-Exit Strategy (As a Day Trader):
Rules 1: Watch Candlestick’s position. If candlesticks cross One Hourly 200
Moving Average from above then switched Fifteen Minute chart.
Rules 2: Watch Fifteen Minute candlesticks pattern. Is it cross 200 Moving
Average. If yes try to identify candlesticks pattern. Engulfing, Doji is the best
candlesticks pattern when 200 Moving Average crossing or retest.
Rules 3: Sell Stop place two to five pips below of identified candlesticks. Also,
place stop-loss two to five pips above of identified candlesticks. Set take profit
level on one hour swing low or 1:2, 1:3 risk-reward ratio on the one-hour time frame.
Below rules, you can follow when you adopt Multi time frame 200 Moving
Average Buy Entry-Exit Strategy (As a Position Trader):
Rules 1: Watch Candlestick’s position. If candlesticks cross Weekly 200 Moving
Average from below then switched daily chart.
Rules 2: Watch the daily candlesticks pattern. Is it cross 200 Moving Average. If yes
try to identify candlesticks pattern. Engulfing, Doji is the best candlesticks pattern
when 200 Moving Average crossing or retest.
Rules 3: Buy Stop place two to five pips above of identified candlesticks. Also,
place stop-loss two to five pips below of identified candlesticks. Set take profit
level on the weekly swing high or 1:2, 1:3 risk-reward ratio on the weekly time frame.
Below rules, you can follow when you adopt Multi time frame 200 Moving
Average Sell Entry-Exit Strategy (As a Position Trader):
Rules 1: Watch Candlestick’s position. If candlesticks cross weekly 200 Moving
Average from above then switched daily chart.
Rules 2: Watch the daily candlesticks pattern. Is it cross 200 Moving Average. If yes
try to identify candlesticks pattern. Engulfing, Doji is the best candlesticks pattern
when 200 Moving Average crossing or retest.
Rules 3: Sell Stop place two to five pips below of identified candlesticks. Also,
place stop-loss two to five pips above of identified candlesticks. Set take profit
level on the weekly swing low or 1:2, 1:3 risk-reward ratio on the weekly time frame.
Wish you Best of Luck
——- Thanks for giving your valuable time to stay with us ——–


