 Earn Money Forex Best Forex Trading Experience


200 Moving Average Strategies. (Part -7)
Friends……….
A lot of thanks for visit earnmoneyfx.com
As a series part strategy of 200 Moving Average Strategy, earnmoneyfx.com research
team suggests you to follow various type entry-exit strategies of 200 Simple Moving
Average as below:
1. Support & Resistance
2. 200 MA Bounce
3. Trend line
4. Ascending Triangle
5. Descending Triangle
6. Symmetrical Triangle
7. Flag Pattern
8. Channel
9. Candlesticks Pattern
10. Golden Cross
11. Death Cross
12. Double Golden Cross
13. Double Death Cross
14. Short term & Midterm moving average cross
15. Multi time frame analysis.
Please note all the above strategies are demo tested by the earnmoneyfx.com research team
which success ratio was sixty to seventy-five percent. If you follow our direction as
accurately when entry and exit, we sure that your trading result must better day by day.
200 Moving Average Strategy (Part -1) we have discussed about the structure of 200 Moving
Average, types of 200 Moving Average and 200 Moving Average Support and
Resistance Entry-Exit Strategy in detail.
The above link is for your ready references.
200 Moving Average Strategy (Part -2), we have discussed about 200 Moving Average
Bounce Entry-Exit Strategy in detail.
The above link is for your ready references.
200 Moving Average Strategy (Part -3), we have discussed about How to Entry and Exit
Trend line and 200 Moving Average.
The above link is for your ready references.
200 Moving Average Strategy (Part -4), we have discussed about Ascending Triangle
with 200 Moving Average Entry-Exit Strategy, Descending Triangle with 200 Moving
Average Entry-Exit Strategy and Symmetrical Triangle with 200 Moving Average
Entry-Exit Strategy.
Above link is for your ready references.
200 Moving Average Strategy (Part -5), we have discussed about Bullish flag pattern
with 200 Moving Average Entry-Exit Strategy, Bearish flag pattern with 200 Moving
Average Entry-Exit Strategy, Bullish Channel Pattern with 200 Moving Average Entry
Exit Strategy, Bearish Channel Pattern with 200 Moving Average Entry-Exit Strategy
Above link is for your ready references.
200 Moving Average Strategy (Part -6), we have discussed about Golden Cross Entry-Exit
Strategy, Death Cross Entry-Exit Strategy.
Above link is for your ready references.
If you missed all or anyone, Earnest request you to visit 200 Moving Average Strategy (Part
-1), 200 Moving Average Strategy (Part -2), 200 Moving Average Strategy (Part -3), 200
Moving Average Strategy (Part -4), 200 Moving Average Strategy (Part -5) and 200 Moving
Average Strategy (Part -6) in earnmoneyfx.com
These article earnmoneyfx.com research teams try to cover another strategy as below.
*** Double Golden Cross Entry-Exit Strategy ***
*** Double Death Cross Entry-Exit Strategy ***
Let’s explore all ……….
Double Golden cross and Double Death cross are actually crossing above and below of
three moving averages. Before deep drive in Double Golden cross and Double Death cross
at first we have to know what Moving Averages is and how Moving averages are structured.
Let’s check below …..
Moving Average are various types. E.g. Simple Moving Average (SMA), Exponential Moving
Average (EMA), Smoothed Moving Average (SMMA), etc.
Simple Moving Average (SMA) and Exponential Moving Average (EMA) are the most uses of
this strategy because of its easy to calculate and understand.
As per earnmonreyfx.com research team demo test, this strategy works well any
timeframe and any pair.
For good success rate, we suggest you One Hourly, Four Hourly, Daily timeframe and major
pair (EURUSD, GBPUSD, AUDUSD, NZDUSD, USDCHF, USDCAD, USDJPY, EURJPY, GBPJPY),
XAUUSD, XAUEUR, CRUDE OIL, and S&P500
Definition and Calculation of Simple Moving Average (SMA):
A simple moving average is formed by calculating the average price of a currency
over a specific number of periods.
Most moving averages are based on closing prices; for example, a 5-day simple moving
average is the five-day sum of closing prices divided by five.
As its name implies, a moving average is an average that moves.
Old data is dropped as new data becomes available, causing the average to move along the
time scale.
The example below shows a 5-day moving average evolving over three days.
Daily Closing Prices: 11,12,13,14,15,16,17
First day of 5-day SMA: (11 + 12 + 13 + 14 + 15) / 5 = 13
Second day of 5-day SMA: (12 + 13 + 14 + 15 + 16) / 5 = 14
Third day of 5-day SMA: (13 + 14 + 15 + 16 + 17) / 5 = 15
The first day of the moving average simply covers the last five days.
The second day of the moving average drops the first data point (11) and adds the new
data point (16).
The third day of the moving average continues by dropping the first data point (12) and
adding the new data point (17).
In the example above, prices gradually increase from 11 to 17 over a total of seven days.
Notice that the moving average also rises from 13 to 15 over a three-day calculation period.
Also, notice that each moving average value is just below the last price. For example, the
moving average for day one equals 13 and the last price is 15. Prices the prior four days
were lower and this causes the moving average to lag.
For your kind information, Any moving average strategy is a trend trading system.
Moving Average work well when prices are uptrend or downtrend.
In choppy or sideways market moving average strategies are unable to well.
So we always avoid using moving average strategies when markets are choppy or
sideways.
Otherwise its chance to hit stop loss more and more.
Simple Moving Average is the default indicator in Metatrader4 or Metatrader5.
Metatrader4 Simple Moving Average plot as below
Open Metatrader4> Insert> Indicator> Trend> Moving Average> Simple> OK
Important things,
We will take our BUY decision when the price is above 200 Simple Moving Average.
Also, We will take our SELL decision when the price is below 200 Simple Moving Average.
What is Exponential Moving Average (EMA)?
An exponential moving average (EMA) is a type of moving average (MA) that places a greater weight
and significance on the most recent data points.
The exponential moving average is also referred to as the exponentially weighted moving
average.
An exponentially weighted moving average reacts more significantly to recent price
changes than a simple moving average (SMA), which applies an equal weight to all
observations in the period.
Shortcut calculation of Exponential Moving Average (EMA):
Exponential Moving Average (EMA) = Price (T) X K + EMA (Y) X (1-k)
Where,
T= Today
Y= Yesterday
N= Number of Day in Exponential Moving Average
K= 2 / (N+1)
Don’t worry about Exponential Moving Average critical calculation.
Exponential Moving Average is the default indicator in Metatrader4 or Metatrader5.
Metatrader4 Exponential Moving Average plot as below
Open Metatrader4 >Insert> Indicator> Trend> Moving Average> Exponential >OK
Important things,
We will take our BUY decision when the price is above 200 Exponential Moving Average.
Also, we will take our SELL decision when the price is below 200 Exponential Moving Average.
Double Golden Cross Entry-Exit Strategy:
Before exploring Double Golden Cross Entry-Exit Strategy at first we learn to know what is
Double Golden Cross.
What is Double Golden Cross: Few time world heavyweight news channel or newspaper
(e.g. BBC, CNN, and BLOOMBERG) published breaking news that EURUSD created Golden
Cross. After this news market tries to creating new high and high. It’s specially BUY mood
because of Golden Cross.
Actually when Short term Moving Average and Midterm Moving Average crosses Long
Term Moving Averages from below than market create Double Golden Cross.
As very much simple, When 50 Simple Moving Average and 200 Simple Moving Average
crosses 200 Simple Moving Average from below its Double Golden Cross. You also can use
Exponential Moving Average here.
Image 1: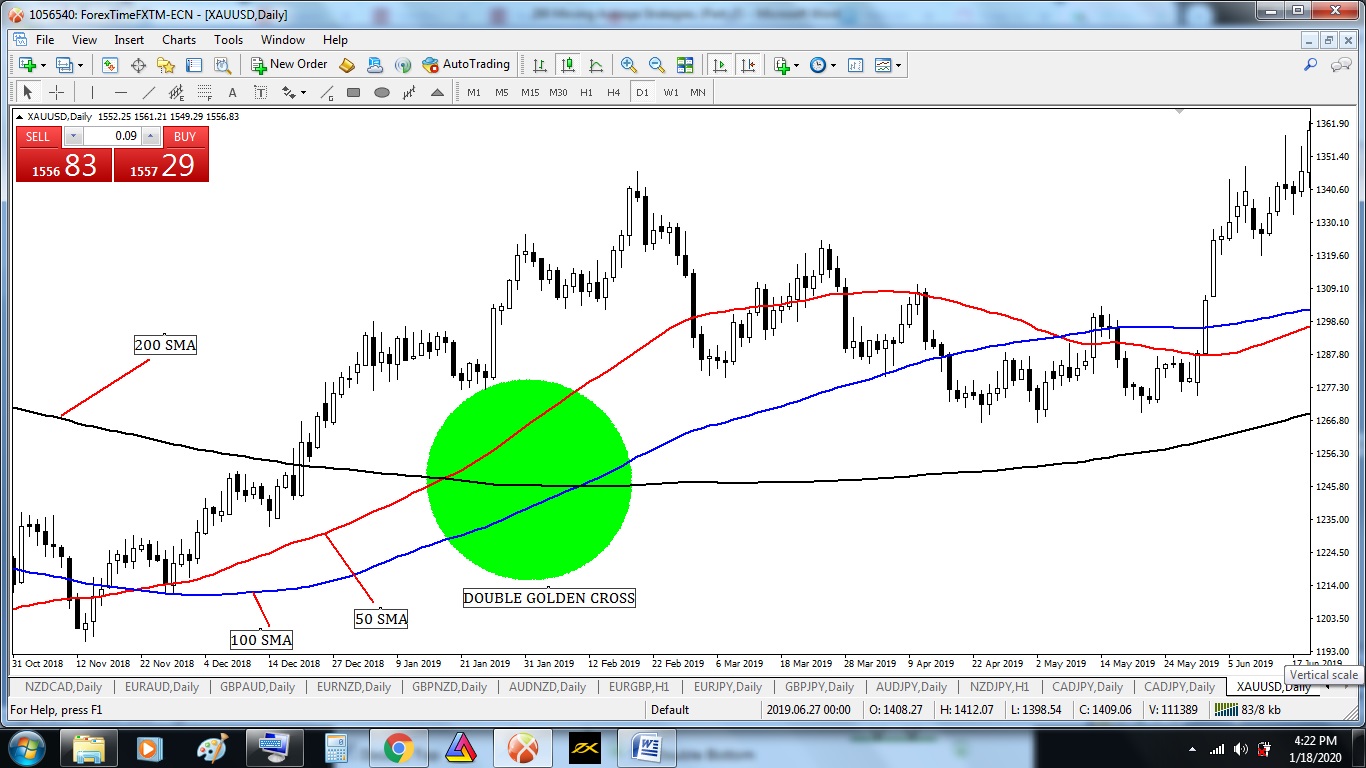
Double Golden Cross (50 Simple Moving Average and 100 Simple Moving
Average crosses 200 Simple Moving Average from below)
Various types of Double Golden Cross Entry and Exit Strategy are practiced in financial
market.
Earnmoneyfx.com research team suggest you two most usable strategy which success rate
is eighty to ninety percent if you follow our instructions properly.
Those are
1. Aggressive Entry and Exit Strategy when Golden Cross and Double Golden Cross.
2. Traders Action Zone (TAZ) Entry and Exit Strategy.
Let’s explore both…..
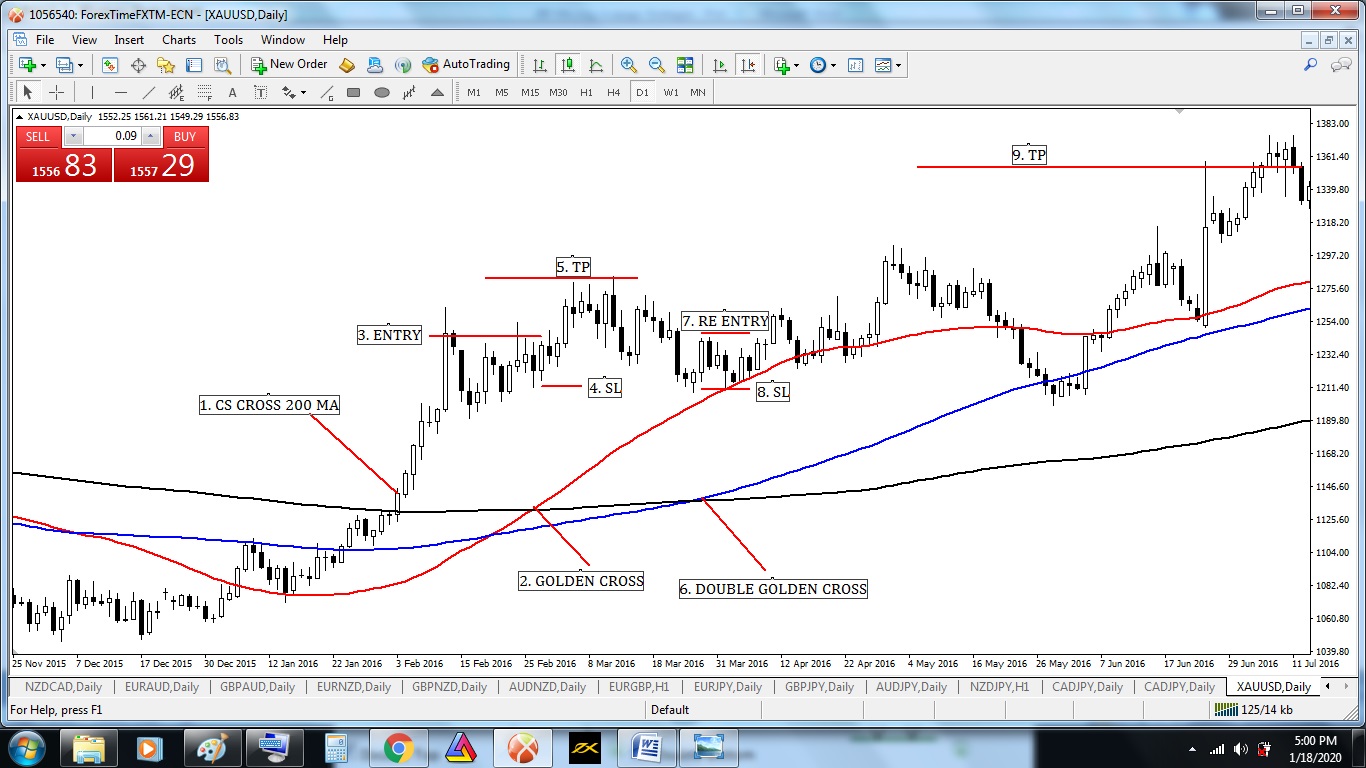
Aggressive Entry and Exit Strategy when Golden Cross and Double Golden
Cross.
Image point number – 1, We see candlesticks close above 200 Moving Average. That
means its uptrend. Also, its time to wait and watch as per Aggressive Entry and Exit
Strategy when Golden Cross.
Image point number – 2, Maintaining slide sideways above 200 Simple Moving Average
where candlesticks never close below 200 Simple Moving Average. That means the price is till
now bullish. We have to wait for the Golden Cross.
At last Golden Cross was created. We hope that price will go up massively.
Image point number – 3, Aggressive or conservative trader put their BUY STOP order 2
pips above of Golden Crossing candlesticks.
Image point number – 4, After hit BUY STOP order aggressive trader place STOP LOSS 2
pips below of entry CS.
Where, Conservative traders place STOP LOSS 2 pips below of 50 Simple Moving Average
or 200 Simple Moving Average.
Image point number – 5, Conservative or aggressive traders place their take profit level on
the near swing high or 1: 2 or 1 : 3 risk-reward ratio.
Image point number – 6, After hitting the previous setup TP Price is till now above 200
Simple Moving Average where candlesticks never close below 200 Simple Moving Average.
That means the price is till now bullish. We have to wait for the Double Golden Cross.
At last Double Golden Cross was created. We hope that price will go up massively.
Image point number – 7, Aggressive or conservative trader put their BUY STOP order 2
pips above of Double Golden Crossing candlesticks.
Image point number – 8, After hit BUY STOP order aggressive trader place STOP LOSS 2
pips below of entry CS.
Where, Conservative traders place STOP LOSS 2 pips below of 50 Simple Moving Average
or 100 Simple Moving Average or 200 Simple Moving Average.
Image point number – 9, Conservative or aggressive traders place their take profit level on
near swing high or 1 : 2 or 1 : 3 risk-reward ratio.
Image 3: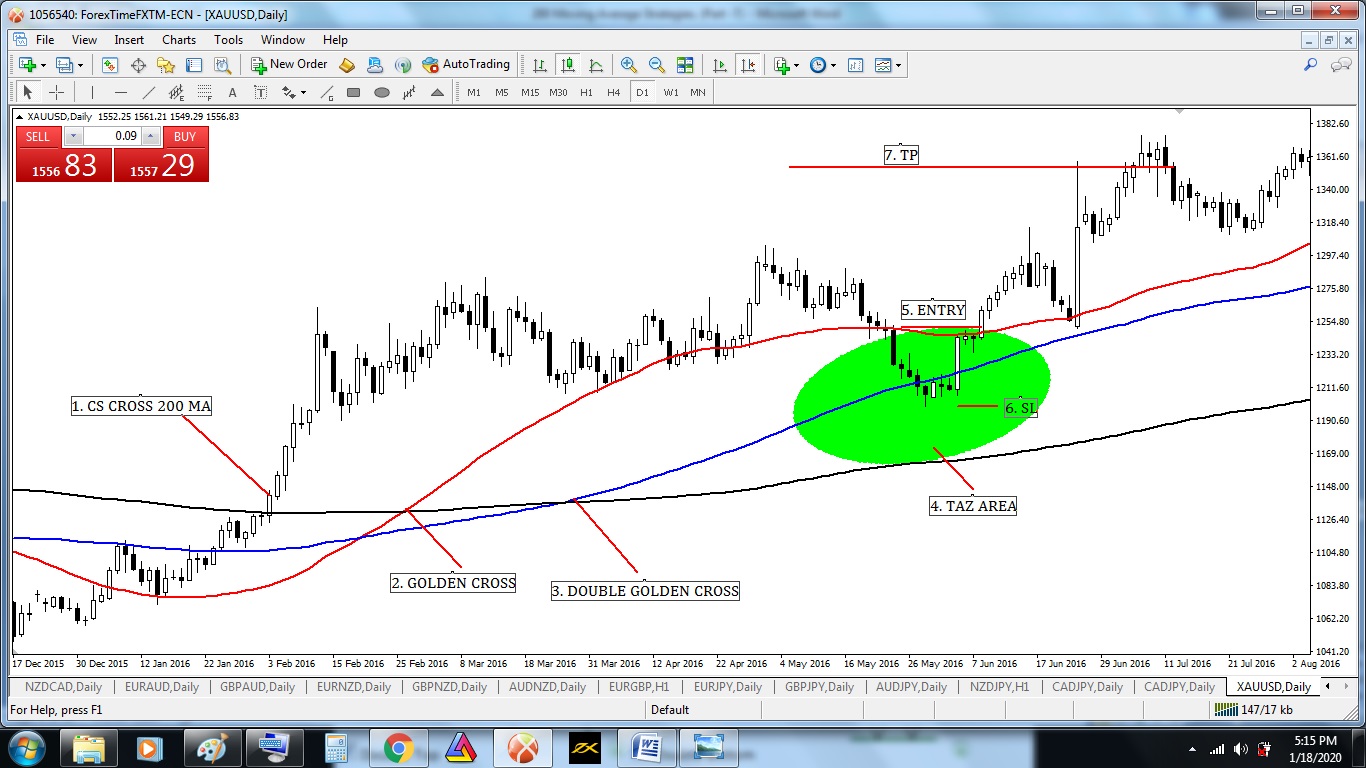
Traders Action Zone (TAZ) Entry and Exit Strategy.
What is Traders Action Zone (TAZ): Before exploring this strategy, At first we have to
know what is Traders Action Zone (TAZ).
Traders Action Zone (TAZ) is actually this area of the chart where swing trader and pullback
trader take their position. Swing trader and pullback trader wait until price come Traders
Action Zone (TAZ).
Traders Action Zone (TAZ) area determined variously based on strategy,
This Golden Cross strategy Traders Action Zone (TAZ) is between 50 Simple Moving
Average and 200 Simple Moving Average until setup invalid.
Let’s explore….
Image point number – 1, We see candlesticks close above 200 Moving Average. That
means its uptrend. Also, its time to wait and watch as per Traders Action Zone (TAZ) Entry
and Exit Strategy.
Image point number – 2, After Golden Cross price goes up massively. But as per Traders
Action Zone (TAZ) Entry and Exit Strategy we have to wait until the price comes back Traders
Action Zone (TAZ).
Image point number – 3, After Double Golden Cross price maintain sideways. But as per
Traders Action Zone (TAZ) Entry and Exit Strategy we have to wait until the price comes back
Traders Action Zone (TAZ).
Image point number – 4, At last price come back in Traders Action Zone (TAZ). Now time
to Look for bullish price action reversal candlesticks pattern (PIN BAR, BULLISH
ENGULFING, MORNING STAR, HAMMER, HARAMI, PIERCING, DOJI, etc.)
Image point number – 5, Aggressive or conservative trader put their BUY STOP order 2
pips above of Bullish Engulfing candlesticks in Traders Action Zone (TAZ) area.
Image point number – 6, After hit BUY STOP order aggressive trader place STOP LOSS 2
pips below of Bullish Engulfing candlesticks.
Where, Conservative traders place STOP LOSS 2 pips below of 200 Simple Moving Average.
Image point number – 7, Conservative or aggressive traders place their take profit level on
the near swing high or 1 : 2 or 1 : 3 risk-reward ratio.
Death Cross Entry-Exit Strategy:
Before exploring the Double Death Cross Entry-Exit Strategy at first we learn to know what is
Double Death Cross.
What is Double Death Cross: Few time world heavyweight news channels or newspapers
(e.g. BBC, CNN, and BLOOMBERG) published breaking news that EURUSD created Double
Death Cross. After this news market tries to create new low and low. It’s specially SELL
mood because of Double Death Cross.
Actually when Short term Moving Average and Midterm Moving Average crosses Long
Term Moving Averages from above then market create Double Death Cross.
As very much simple, When 50 Simple Moving Average and 200 Simple Moving Average
crosses 200 Simple Moving Average from above its Double Death Cross. You also can use
Exponential Moving Average here. Various types of Death Cross Entry and Exit Strategy are
practiced in the financial market.
Earnmoneyfx.com research team suggests you two most usable strategies which success
rate is eighty to ninety percent if you follow our instructions properly.
Those are….
1. Aggressive Entry and Exit Strategy when Death Cross and Double Death Cross.
2. Traders Action Zone (TAZ) Entry and Exit Strategy.
Let’s explore both…..
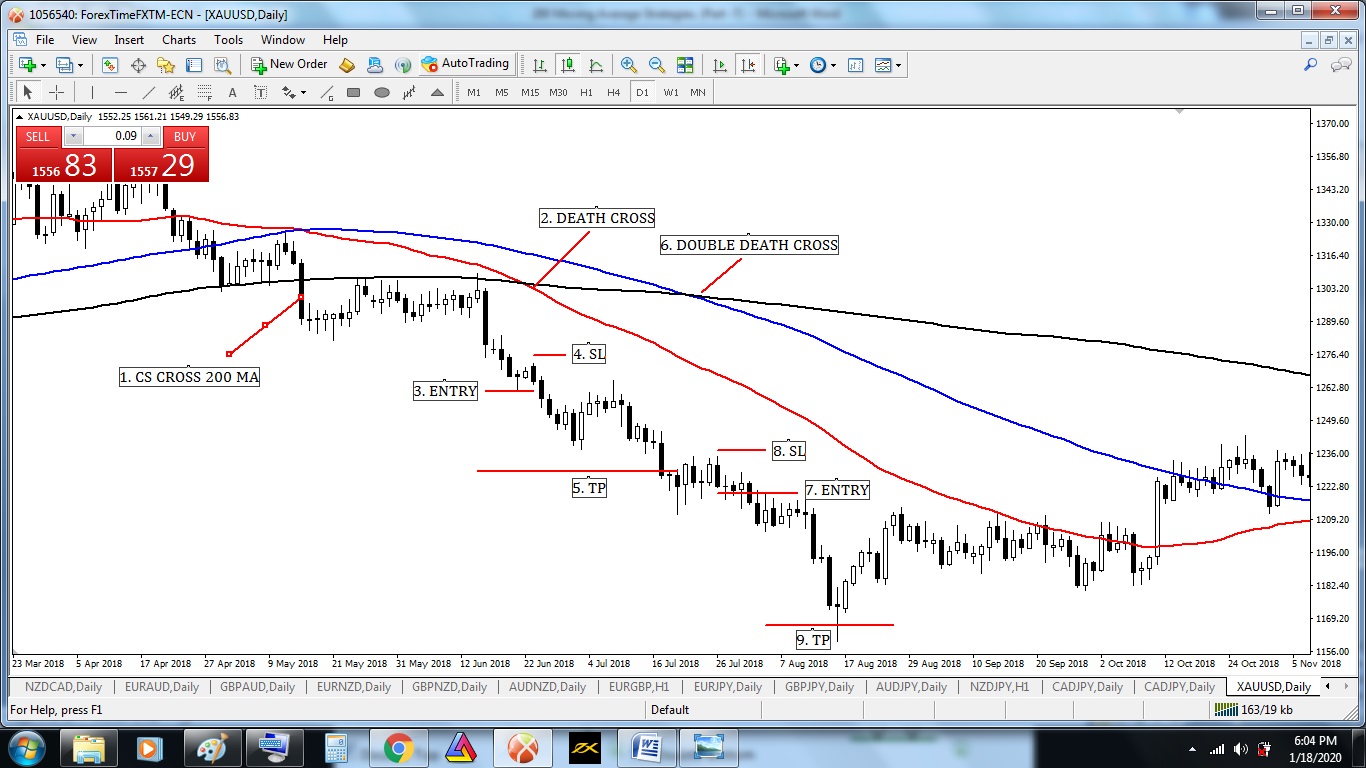
Aggressive Entry and Exit Strategy when Death Cross and Double Death
Cross.
Image point number – 1, We see candlesticks close below 200 Moving Average. That
means its downtrend. Also, its time to wait and watch as per Aggressive Entry and Exit
Strategy when Death Cross and Double Death Cross.
Image point number – 2, Maintaining slide sideways below 200 Simple Moving Average
where candlesticks never close below 200 Simple Moving Average. That means the price is till
now bearish. We have to wait for Death Cross.
At last Death, Cross was created. We hope that price will go down massively.
Image point number – 3, Aggressive or conservative trader put their SELL STOP order 2
pips below of Death Crossing candlesticks.
Image point number – 4, After hit SELL STOP order aggressive trader place STOP LOSS 2
pips above of entry CS.
Where Conservative traders place STOP LOSS 2 pips above of 50 Simple Moving Average
or 200 Simple Moving Average.
Image point number – 5, Conservative or aggressive traders place their take profit level on
the near swing low or 1: 2 or 1 : 3 risk-reward ratio.
Image point number – 6, After hitting the previous setup TP Price is till now below 200
Simple Moving Average where candlesticks never close above 200 Simple Moving Average.
That means the price is till now bearish. We have to wait for Double Death Cross.
At last Double Death Cross was created. We hope that price will go down massively.
Image point number – 7, Aggressive or conservative trader put their SELL STOP order 2
pips above of Double Death Crossing candlesticks.
Image point number – 8, After hit SELL STOP order aggressive trader place STOP LOSS 2
pips above of entry CS.
Where Conservative traders place STOP LOSS 2 pips above of 50 Simple Moving Average
or 100 Simple Moving Average or 200 Simple Moving Average.
Image point number – 9, Conservative or aggressive traders place their take profit level on
the near swing high or 1: 2 or 1 : 3 risk-reward ratio.
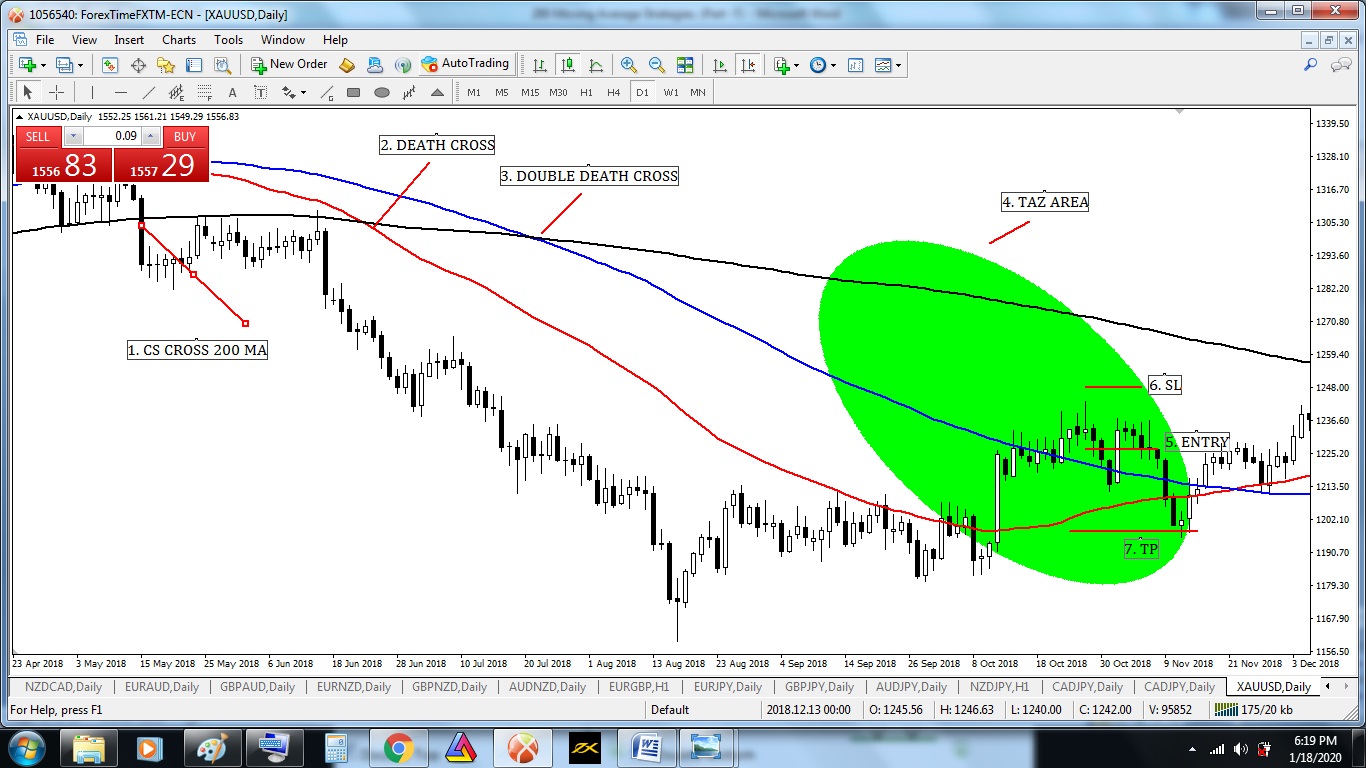
Traders Action Zone (TAZ) Entry and Exit Strategy.
Image point number – 1, We see candlesticks close below 200 Moving Average. That
means its downtrend. Also, its time to wait and watch as per Traders Action Zone (TAZ)
Entry and Exit Strategy.
Image point number – 2, After Death Cross price goes down massively. But as per Traders
Action Zone (TAZ) Entry and Exit Strategy we have to wait until the price comes back Traders
Action Zone (TAZ).
Image point number – 3, After Double Death Cross price are sideways. But as per Traders
Action Zone (TAZ) Entry and Exit Strategy we have to wait until the price comes back Traders
Action Zone (TAZ).
Image point number – 4, At last price come back in Traders Action Zone (TAZ). Now time
to Look for bearish price action reversal candlesticks pattern (PIN BAR, BEARISH
ENGULFING, SHOOTING STAR, HARAMI, DARK CLOUD COVER, DOJI, etc.)
Image point number – 5, Aggressive or conservative trader put their SELL STOP order 2
pips below of PIN BAR in the Traders Action Zone (TAZ) area.
Image point number – 6, After hit SELL STOP order aggressive trader place STOP LOSS 2
pips above of PIN BAR candlesticks.
Where, Conservative traders place STOP LOSS 2 pips above of 200 Simple Moving Average.
Image point number – 7, Conservative or aggressive traders place their take profit level on
the near swing high or 1: 2 or 1 : 3 risk-reward ratio.
——- Thanks for giving your valuable time to read this article ——–
(To be continued)


