 Earn Money Forex Best Forex Trading Experience


200 Moving Average Strategies. (Part -3)
Friends……….
A lot of thanks for visit earnmoneyfx.com
As a series part strategy of 200 Moving Average Strategy, earnmoneyfx.com research team suggests you to follow various type entry-exit strategies of 200 Simple Moving Average as below:
- Support & Resistance
- 200 MA Bounce
- Trend line
- Ascending Triangle
- Descending Triangle
- Flag Pattern
- Channel
- Candlesticks Pattern
- Golden Cross
- Death Cross
- Short term & Midterm moving average cross
- Multi-time frame analysis.
Please note all the above strategies are demo tested by the earnmoneyfx.com research team which success ratio was sixty to seventy-five percent. If you follow our directions as accurately when entry and exit, we are sure that your trading result must be better day by day.
200 Moving Average Strategy (Part -1) we have discussed the structure of 200 Moving Average, types of 200 Moving Average and 200 Moving Average Support and Resistance Entry-Exit Strategy in detail.
https://www.earnmoneyfx.com/the-200-day-moving-average-strategy-guide/
The above link is for your ready references.
200 Moving Average Strategy (Part -2) we have discussed about 200 Moving Average Bounce Entry-Exit Strategy in detail.
If you missed all or anyone, Earnest request you to visit 200 Moving Average Strategy (Part -1) and 200 Moving Average Strategy (Part -2) in earnmoneyfx.com
This article earnmoneyfx.com research teams try to cover another strategy as below.
*** How to Entry and Exit Trend line and 200 Moving Average ***
Let’s explore ………
How to Entry and Exit Trend line and 200 Moving Average:
Before exploring how to Entry and Exit Trend line and 200 Moving Average at first we learn to know what is Trend Line and How to draw trend line properly.
What is Trend Line: In the world of FOREX, STOCK and COMMODITIES market, There is a most common sentence we heard,
TREND IS FRIEND
It is absolutely right. FOREX, STOCK, and COMMODITIES market are always either uptrend/downtrend or sideways.
It will be easy to earn from FOREX, STOCK, and COMMODITIES market if you identify trends properly. Whatever its uptrend or downtrend.
TREND LINE is one of the major tools to identify trends.
As per Investopedia, the Trend line is a line that draws over pivot highs or under pivot lows which shows the prevailing direction of price. That means,
When the price is on an uptrend, the trend line draws under pivot low.
When the price is in a downtrend, the trend line draws over pivot high.
For your information,
Few traders connect the trend line with the swing low when drawing an uptrend trend line.
Few traders connect the trend line with the swing high when drawing a downtrend trend line.
Few traders want to avoid only connecting the trend line with the swing low, they try to connect most of the candlesticks low when drawing an uptrend trend line.
Few traders want to avoid only connecting the trend line with the swing high, they try to connect most of the candlesticks high when drawing a downtrend trend line.
Few traders avoid Japanese candlesticks, they only use line charts when drawing a trend line.
Are u confused!!
I am sure you are confused. You want to know which way is best to draw a trend line.
There is nothing to worry.
earnmoneyfx.com research team suggest that you can draw a trend line anyway but you have to be sure that you connect two or more swing point.
Here two or more swing point connection is very very important. Two or more candlesticks connect is not important. You can connect more candlesticks for a strong trend line.
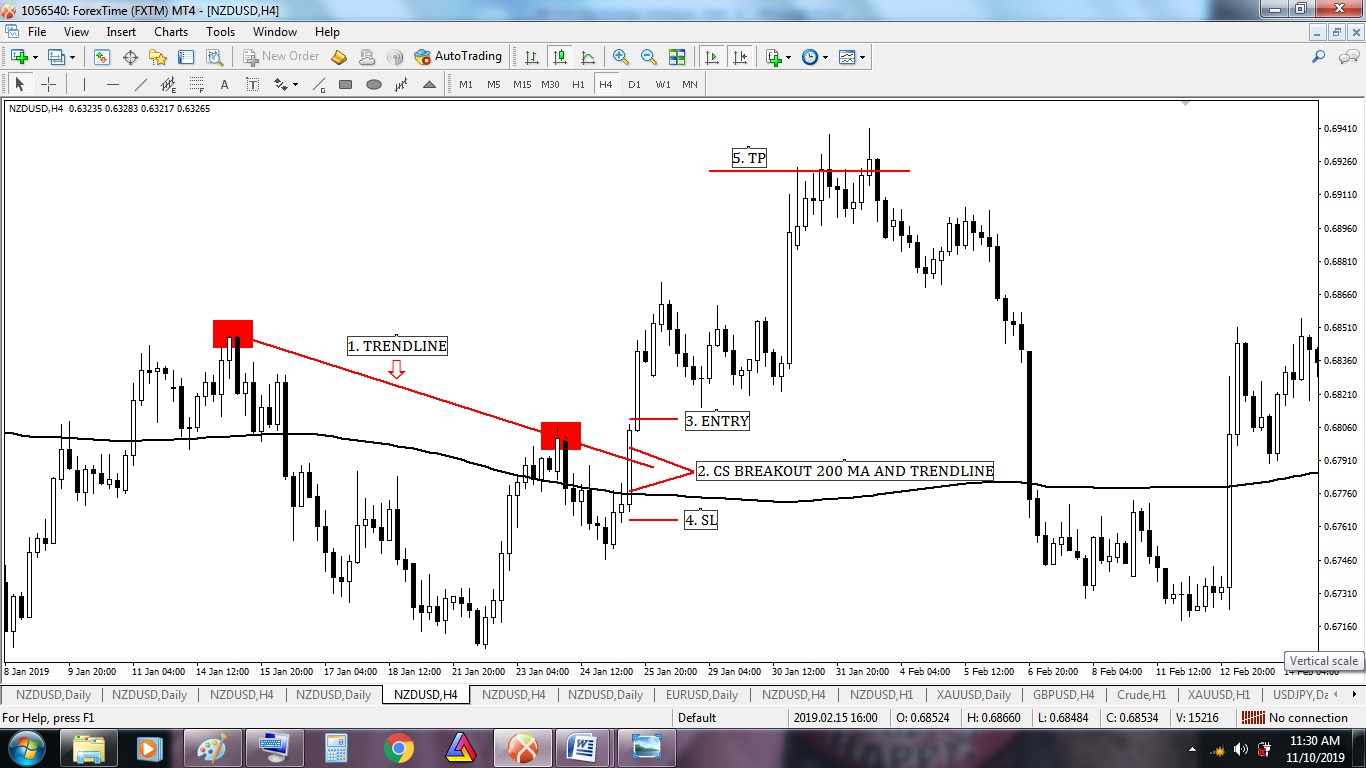
200 Moving Average and Trend Line Breakout Entry-Exit Strategy (BUY)
Image point number – 1, We see the strong downtrend of price with few swings. As per trend line rules, we draw a trend line here by connecting two swings high.
Image point number – 2, Candlesticks break out 200 Moving Average and Trend line same time. It’s our entry candle.
Image point number – 3, Aggressive or conservative trader put their BUY STOP order 2 pips above of 200 Moving Average and Trend line break out candlesticks.
Image point number – 4, After hit BUY STOP order aggressive or conservative trader place STOP LOSS 2 pips below of 200 Moving Average and trend line breakout candlesticks. Few traders place STOP LOSS 2 pips below of 200 Moving Average.
Image point number – 5, Conservative or aggressive trader place their take profit level on near swing high or 1 : 2 or 1 : 3 risk-reward ratio.
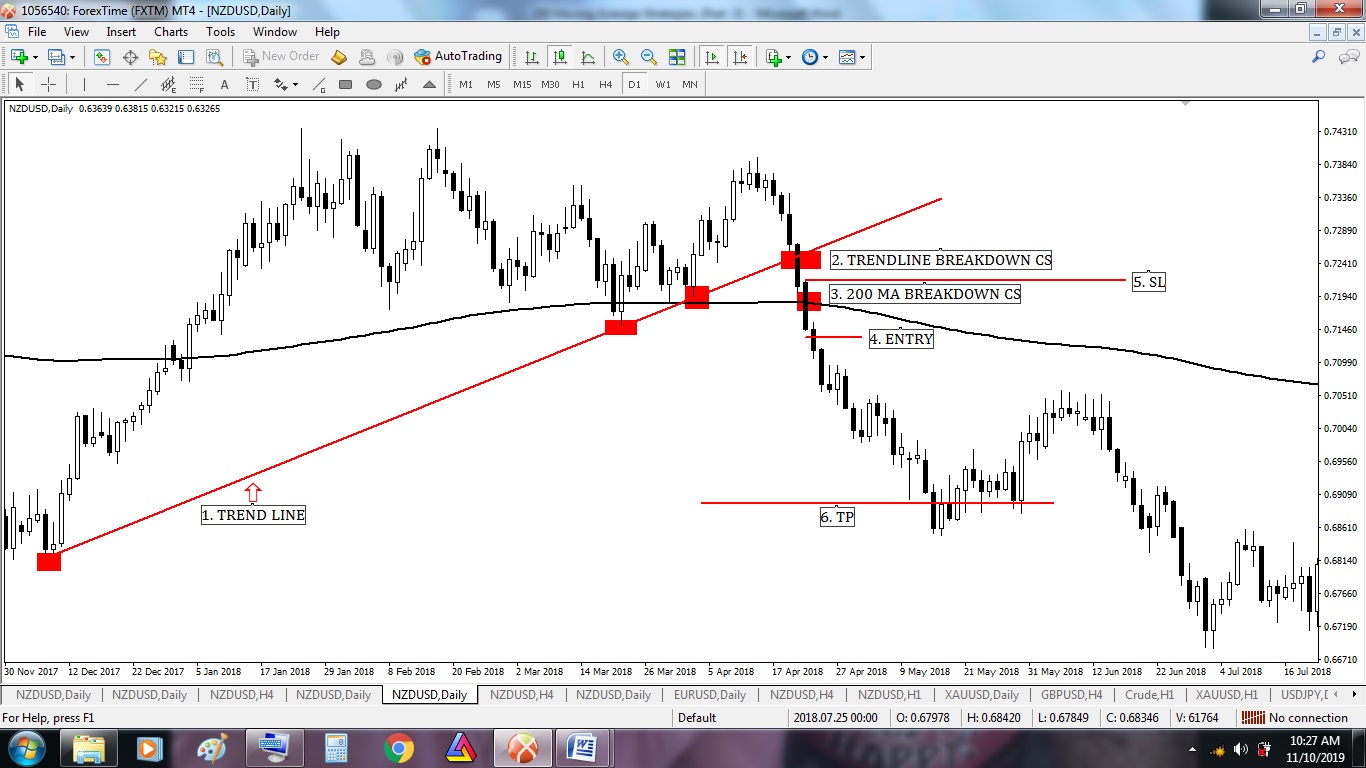
200 Moving Average and Trend Line Break Down Entry-Exit Strategy (SELL)
Image point number – 1, We see a strong uptrend of price with few swings. As per trend line rules, we draw a trend line here by connecting two more swing lows.
Image point number – 2, Candlesticks break down trend line. But we do not entry here. Here our main focus is 200 Moving Average. We never sell above 200 Moving Average. So we have to wait for candlesticks to break down 200 Moving Average.
Image point number – 3, Candlesticks break down 200 Moving Average. It’s our entry candle.
Image point number – 4, Aggressive or conservative trader put their SELL STOP order 2 pips below of 200 Moving Average break down candlesticks.
Image point number – 5, After hit SELL STOP order aggressive or conservative trader place STOP LOSS 2 pips above of 200 Moving Average break down candlesticks. Few traders place STOP LOSS 2 pips above of trend line break down candlesticks.
Image point number – 6, Conservative or aggressive trader place their take profit level on the near swing low or 1 : 2 or 1 : 3 risk-reward ratio.
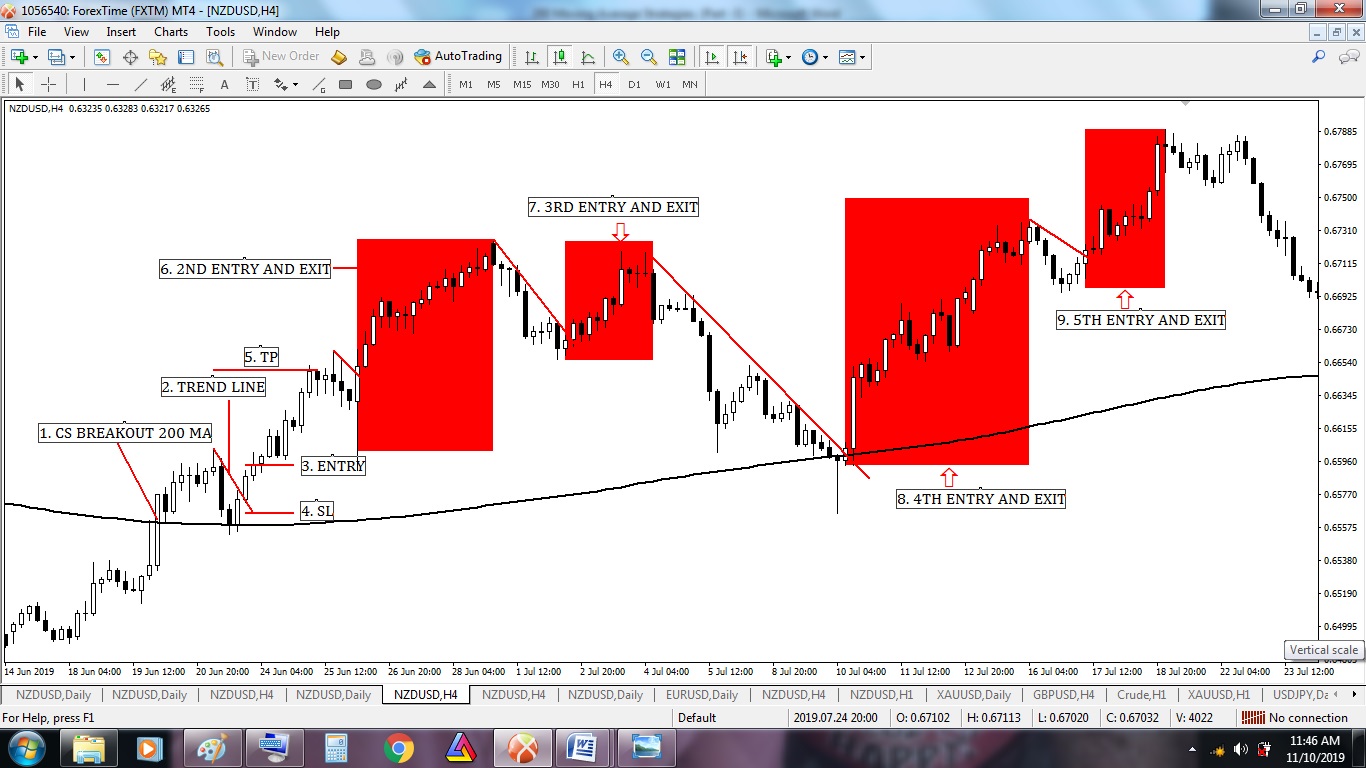
200 Moving Average and Trend Line Breakout Swing Entry-Exit Strategy (BUY)
Image point number – 1, Candlesticks breakout 200 Moving Average. It’s not our entry candle. We have to wait for the breakout trend line.
Image point number – 2, As per trend line rules, we draw a trend line here by connecting two more candlesticks high.
Image point number – 3, Aggressive or conservative trader put their BUY STOP order 2 pips above of trend line breakout candlesticks.
Image point number – 4, After hit BUY STOP order aggressive or conservative trader place STOP LOSS 2 pips below of trend line breakout candlesticks.
Image point number – 5, Conservative or aggressive trader place their take profit level on the near swing high or 1: 2 or 1 : 3 risk-reward ratio.
Image point numbers – 6, 7, 8, and 9, More and more entry and exit scope as per rules.
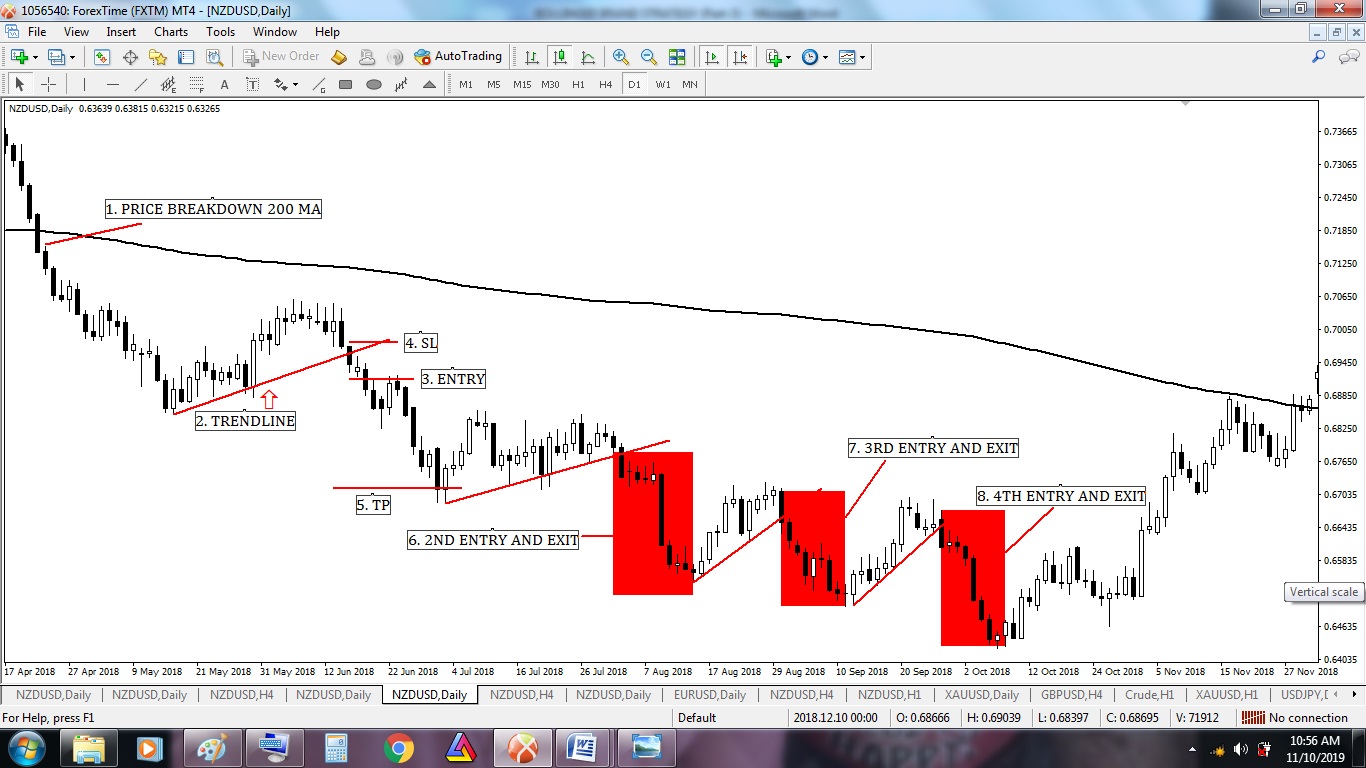
200 Moving Average and Trend Line Break Down Swing Entry-Exit Strategy (SELL)
Image point number – 1, Candlesticks break down 200 Moving Average. It’s not our entry candle. We have to wait to break down the trend line.
Image point number – 2, As per trend line rules, we draw a trend line here by connecting two more candlesticks low.
Image point number – 3, Aggressive or conservative trader put their SELL STOP order 2 pips below of trend line break down candlesticks.
Image point number – 4, After hit SELL STOP order aggressive or conservative trader place STOP LOSS 2 pips above of trend line break down candlesticks.
Image point number – 5, Conservative or aggressive trader place their take profit level on the near swing low or 1: 2 or 1 : 3 risk-reward ratio.
Image point numbers – 6, 7, and 8, More and more entry and exit scope as per rules.
——- Thanks for giving your valuable time to read this article ——–


