Earn Money Forex Best Forex Trading Experience


200 Moving Average Strategies. (Part -5)
Friends……….
A lot of thanks for visiting earnmoneyfx.com
As a series part strategy of 200 Moving Average Strategy, earnmoneyfx.com research
the team suggests you follow various type entry-exit strategies of 200 Simple Moving
Average as below:
1. Support & Resistance
2. 200 MA Bounce
3. Trend line
4. Ascending Triangle
5. Descending Triangle
6. Symmetrical Triangle
7. Flag Pattern
8. Channel
9. Candlesticks Pattern
10. Golden Cross
11. Death Cross
12. Short term & Midterm moving average cross
13. Multi-time frame analysis.
Please note all the above strategies are demo tested by the earnmoneyfx.com research team
which success ratio was sixty to seventy-five percent. If you follow our directions as
accurately when entry and exit, we are sure that your trading result must be better day by day.
200 Moving Average Strategy (Part -1) we have discussed the structure of 200 Moving
Average, types of 200 Moving Average and 200 Moving Average Support and
Resistance Entry-Exit Strategy in detail.
The above link is for your ready references.
200 Moving Average Strategy (Part -2), we have discussed 200 Moving Average
Bounce Entry-Exit Strategy in detail.
200 Moving Average Strategy (Part -3), we have discussed How to Entry and Exit
Trend line and 200 Moving Average.
200 Moving Average Strategy (Part -4), we have discussed Ascending Triangle
with 200 Moving Average Entry-Exit Strategy, Descending Triangle with 200 Moving
Average Entry-Exit Strategy and Symmetrical Triangle with 200 Moving Average
Entry-Exit Strategy.
If you missed all or anyone, Earnest request you to visit 200 Moving Average Strategy (Part
-1), 200 Moving Average Strategy (Part -2), 200 Moving Average Strategy (Part -3) and 200
Moving Average Strategy (Part -4) in earnmoneyfx.com
This article earnmoneyfx.com research teams try to cover another strategy as below.
*** Flag pattern with 200 Moving Average Entry-Exit Strategy ***
*** Channel with 200 Moving Average Entry-Exit Strategy ***
Let’s explore all ……….
Flag pattern with 200 Moving Average Entry-Exit Strategy:
Before exploring the Flag pattern with the 200 Moving Average Entry-Exit Strategy at first we
learn to know what is Flag pattern is.
What is Flag Pattern: The Flag Pattern is actually a continuation pattern. Basically Flag
Patterns find out in the chart after massive or big bullish or bearish movements. Research has
shown that Flag Pattern is one of the most reliable continuation patterns.

As the above image of Flag Pattern, we found below things.
Bullish Flag maintains lower tops and lower bottoms. Also, the pattern goes against up
trend but the channel goes ahead with parallel.
Bearish Flag maintains higher tops and higher bottoms. Also, the pattern goes against
downtrend but the channel goes ahead with parallel.
Minimum two lower tops and two lower bottoms are required to create a bullish flag
pattern.
Minimum two higher tops and two higher bottoms are required to create bearishly
flag pattern.
When we found any bullish flag pattern above 200 Simple Moving Average, Its
shown confirmation for strong buy.
When we found any bearish flag pattern below 200 Simple Moving Average, Its
shown confirmation for strong sell.
We never buy below 200 Simple Moving Average bullish flag pattern as per this
strategy rules.
We never sell above 200 Simple Moving Average bearish flag pattern as per
this strategy rules.
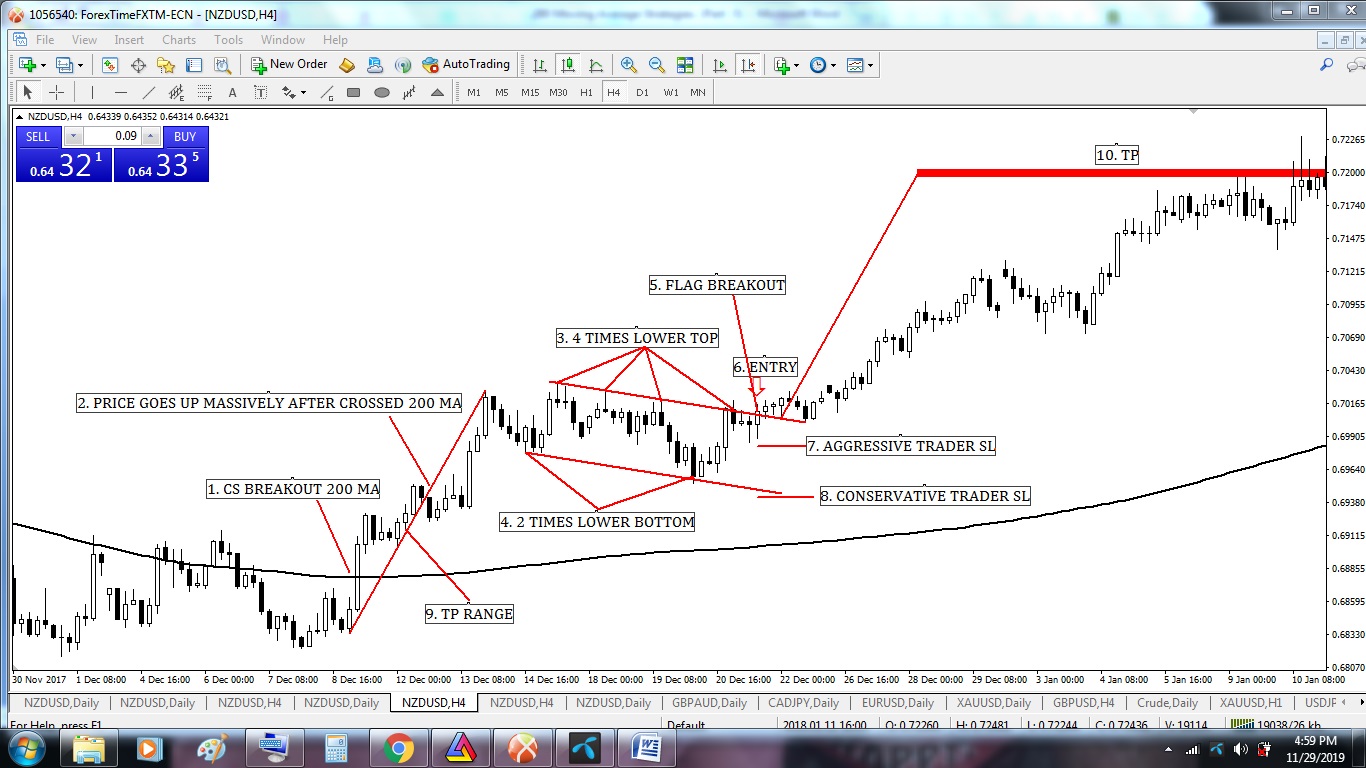
Bullish Flag Pattern with 200 Moving Average Entry-Exit Strategy
Image point number – 1, We see candlesticks breakout 200 Moving Average. That means
it’s an uptrend. Also, its time to wait and watch as per Bullish Flag Pattern with 200 Moving
Average Entry-Exit Strategy rules.
Image point number – 2, Strong uptrend created where the price goes up massively.
Image point number – 3, After strong uptrend price gone to correction. Price created four
times lower tops but failure, to breakout.
Image point number – 4, Price created two times lower bottom. We concretely found
a bullish flag pattern in the chart. Now we have to wait for a breakout.
Image point number – 5, At last, price breakout bullish flag pattern. As per Bullish Flag
Pattern with 200 Moving Average Entry-Exit Strategy rules its time to buy. But we have to
wait for candlesticks to close above the channel which indicates a successful breakout.
Image point number – 6, Aggressive or conservative trader put their BUY STOP order 2
pips above of Bullish Flag Pattern breakout candlesticks.
Image point number – 7, After hit BUY STOP order aggressive trader place STOP LOSS 2
pips below of Bullish Flag Pattern breakout candlesticks.
Image point number – 8, Conservative traders place STOP LOSS 2 pips below of Bullish
Flag Pattern lower channel.
Image point number – 9, As per Bullish Flag Pattern exit rules, we measure take profit
range.
Image point number – 10, Conservative or aggressive trader place their take profit level
on Bullish Flag, Pattern take profit range or near swing high or 1 : 2 or 1 : 3 risk-reward
ratio.
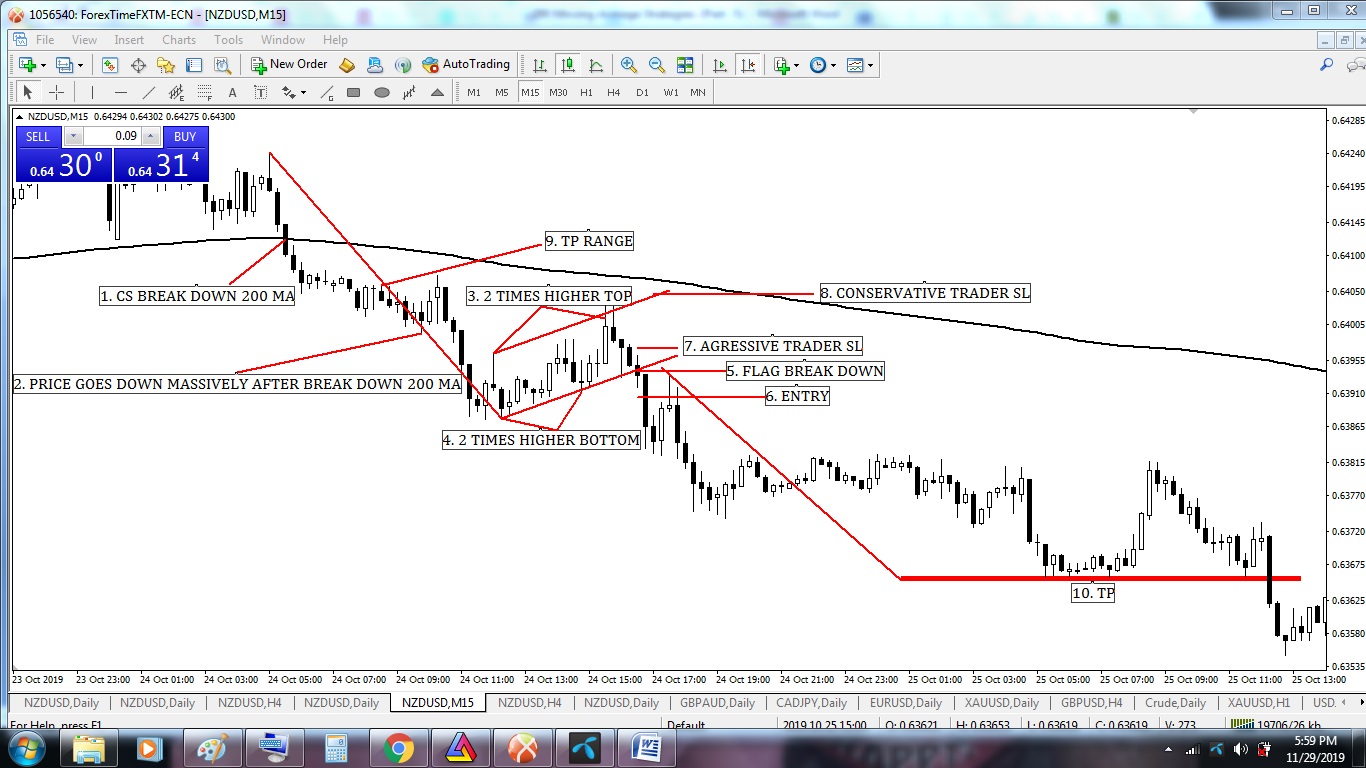
Bearish Flag Pattern with 200 Moving Average Entry-Exit Strategy
Image point number – 1, We see candlesticks break down 200 Moving Average. That
means it’s a downtrend. Also, its time to wait and watch as per Bearish Flag Pattern with 200
Moving Average Entry-Exit Strategy rules.
Image point number – 2, Strong downtrend created where the price goes down massively.
Image point number – 3, After a strong downtrend price went to reversal. Price created
two times higher top.
Image point number – 4, Price created two times higher bottom. We concretely found
a bullish flag pattern in the chart. Now we have to wait for a breakdown.
Image point number – 5, At last, price break down bearish flag pattern. As per Bearish
Flag Pattern with 200 Moving Average Entry-Exit Strategy rules its time to sell. But we have
to wait for candlesticks close below the channel which indicates a successful breakdown.
Image point number – 6, Aggressive or conservative trader put their SELL STOP order 2
pips below of Bearish Flag Pattern break down candlesticks.
Image point number – 7, After hit SELL STOP order aggressive trader place STOP LOSS 2
pips above of Bearish Flag Pattern break down candlesticks.
Image point number – 8, Conservative traders place STOP LOSS 2 pips above of Bearish
Flag Pattern lower channel.
Image point number – 9, As per Bearish Flag Pattern exit rules, we measure take profit
range.
Image point number – 10, Conservative or aggressive trader place their take profit level
on Bearish Flag, Pattern take profit range or near swing high or 1 : 2 or 1 : 3 risk-reward
ratio.
Channel pattern with 200 Moving Average Entry-Exit Strategy:
Before exploring the Channel pattern with the 200 Moving Average Entry-Exit Strategy at first
we learn to know what is Channel pattern.
What is Channel Pattern: Channel Pattern is actually a continuation pattern. It’s also
an indecision area. Basically, Channel Pattern find out in chart after massive or big bullish or
bearish movement. Research has shown that Channel Pattern is one of the most reliable
continuation patterns. Of course, trend lines run parallel. Supply and demand seem
balanced at the moment. Buyers and sellers also seem equal.
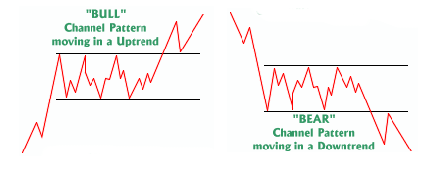
As above image of Channel Pattern, we found below things.
Bullish channels maintain parallel tops and parallel bottoms. Also, the pattern goes
against the uptrend but the channel goes ahead with parallel.
Bearish channels maintain parallel tops and parallel bottoms. Also the pattern goes
against downtrend but the channel goes ahead with parallel.
Minimum two parallel tops and two parallel bottoms are required to create a bullish
channel pattern.
Minimum two parallel tops and two parallel bottoms are required to create bearish
channel pattern.
When we found any bullish channel pattern above 200 Simple Moving Average,
It shows confirmation for a strong buy.
When we found any bearish channel pattern below 200 Simple Moving Average,
It shows confirmation for a strong sell.
We never buy below 200 Simple Moving Average bullish channel pattern as per
this strategy rules.
We never sell above 200 Simple Moving Average bearish channel pattern as
per this strategy rules.
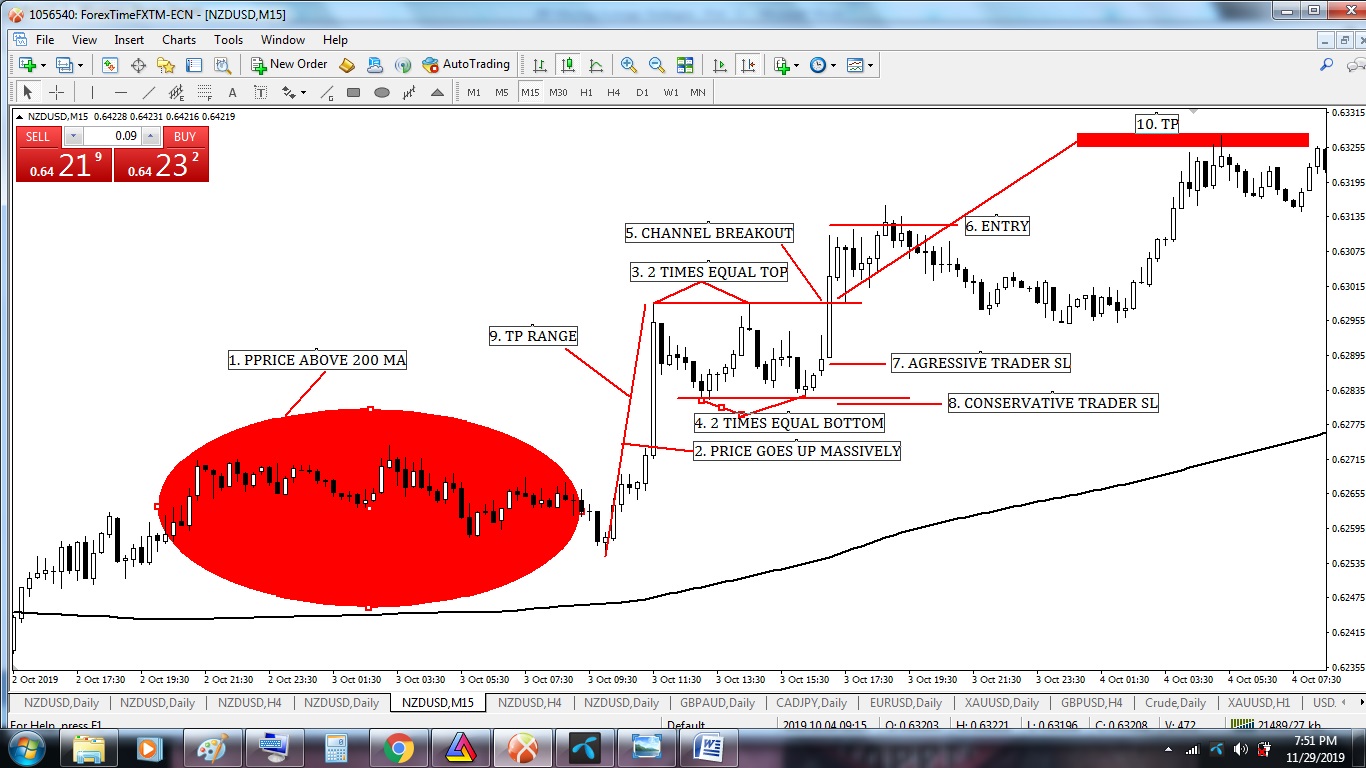
Bullish Channel Pattern with 200 Moving Average Entry-Exit Strategy
Image point number – 1, We see candlesticks above 200 Moving Average. That means its
uptrend. Also, its time to wait and watch as per Bullish channel Pattern with 200 Moving
Average Entry-Exit Strategy rules.
Image point number – 2, Strong uptrend created where the price goes up massively.
Image point number – 3, After strong uptrend price gone to correction. Price created two
times equal tops but failed to breakout.
Image point number – 4, Price created two times equal bottom. We concretely found
a bullish channel pattern in the chart. Now we have to wait for a breakout.
Image point number – 5, At last, price breakout bullish channel pattern. As per Bullish
channel Pattern with 200 Moving Average, Entry-Exit Strategy rules it’s time to buy. But we
have to wait for candlesticks to close above the channel which indicates a successful breakout.
Image point number – 6, Aggressive or conservative trader put their BUY STOP order 2
pips above of Bullish channel Pattern breakout candlesticks.
Image point number – 7, After hit BUY STOP order aggressive trader place STOP LOSS 2
pips below of Bullish channel Pattern breakout candlesticks.
Image point number – 8, Conservative traders place STOP LOSS 2 pips below of Bullish
channel Pattern lower channel.
Image point number – 9, As per Bullish channel Pattern exit rules, we measure take profit
range.
Image point number – 10, Conservative or aggressive trader place their take profit level
on Bullish channel, Pattern take profit range or near swing high or 1 : 2 or 1 : 3 risk-reward
ratio.
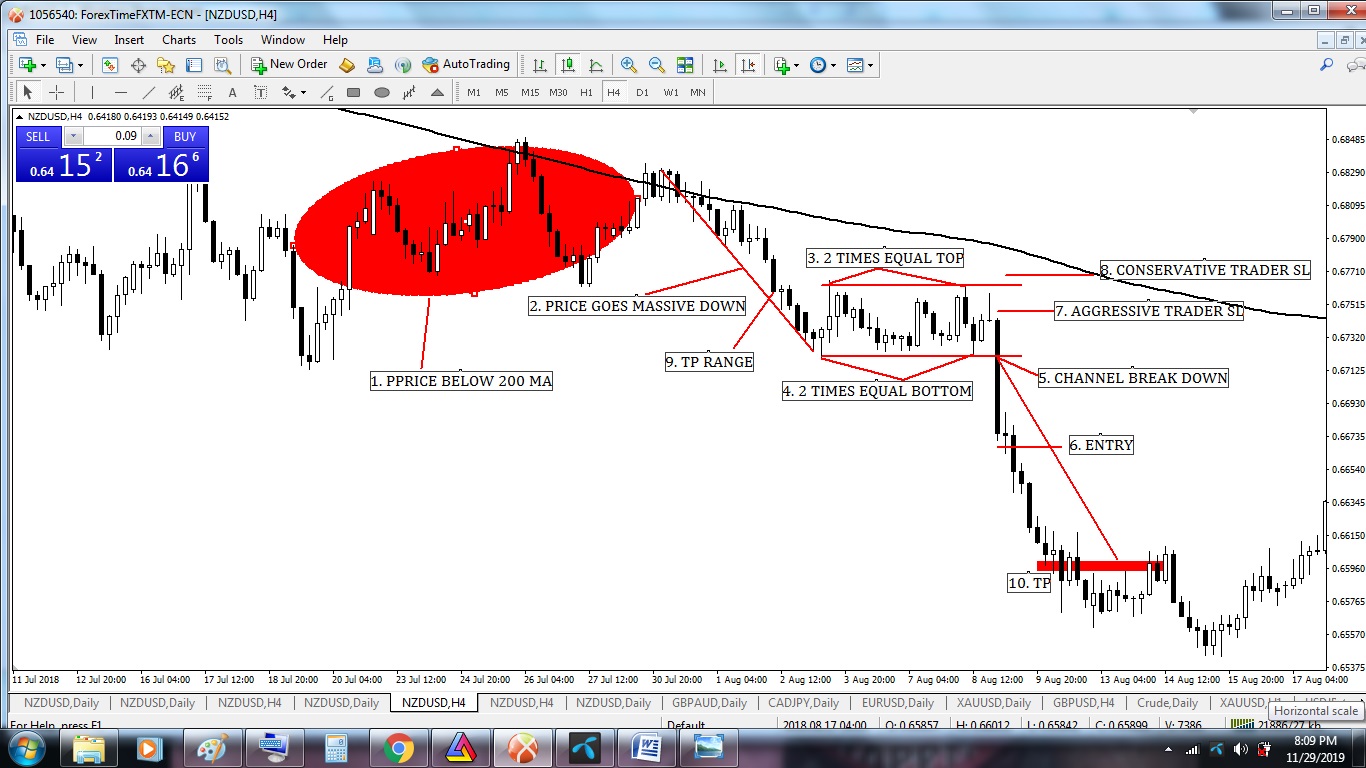
Bearish channel Pattern with 200 Moving Average Entry-Exit Strategy
Image point number – 1, We see candlesticks below 200 Moving Average. That means its
downtrend. Also its time to wait and watch as per Bearish channel Pattern with 200
Moving Average Entry-Exit Strategy rules.
Image point number – 2, Strong downtrend created where the price goes down massively.
Image point number – 3, After a strong downtrend price went to reversal. Price created
two times parallel top.
Image point number – 4, Price created two times parallel bottom. We concretely found
a bullish flag pattern in the chart. Now we have to wait for a breakdown.
Image point number – 5, At last price break down bearish channel pattern. As per Bearish
channel Pattern with 200 Moving Average, Entry-Exit Strategy rules it’s time to sell. But we
have to wait for candlesticks close below the channel which indicates a successful breakdown.
Image point number – 6, Aggressive or conservative trader put their SELL STOP order 2
pips below of Bearish channel Pattern break down candlesticks.
Image point number – 7, After hit SELL STOP order aggressive trader place STOP LOSS 2
pips above of Bearish channel Pattern break down candlesticks.
Image point number – 8, Conservative traders place STOP LOSS 2 pips above of Bearish
channel Pattern lower channel.
Image point number – 9, As per Bearish channel Pattern exit rules, we measure take
profit range.
Image point number – 10, Conservative or aggressive trader place their take profit level
on Bearish channel, Pattern take profit range or near swing high or 1 : 2 or 1 : 3 risk-reward
ratio.
——- Thanks for giving your valuable time to read this article ——–
(To be continued)