 Earn Money Forex Best Forex Trading Experience

200 Moving Average Strategies.
Various type entry-exit strategies of Daily 200 Simple Moving Average as below:
- Support & Resistance
- 200 MA Bounce
- Trend line
- Ascending Triangle
- Descending Triangle
- Flag Pattern
- Channel
- Candlesticks Pattern
- Golden Cross
- Death Cross
- Short term & Midterm moving average cross
- Multi-time frame analysis.
https://www.earnmoneyfx.com/the-200-day-moving-average-strategy-guide/
The above link is a ready reference of the previous discussion about 200 Moving Average strategies (part-1) where I have discussed the structure of 200 Moving Average, types of 200 Moving Average and 200 Moving Average Support and Resistance Entry-Exit Strategy in detail.
As per the continuation of the 200 Moving Average strategy now I discuss the 200 Moving Average bounce entry exit strategy as below.
Let’s discover all
200 Moving Average Bounce Entry-Exit Strategy:
At first, we need to know how to plot 200 Moving Average on Metarader4
Open Metatrader4 > Insert > Indicator > Trend > Moving Average
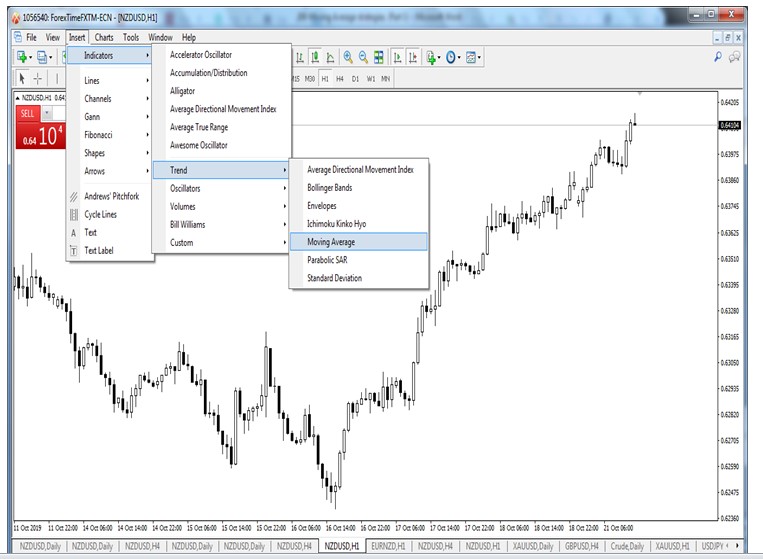
Image 1: How to plot 200 Moving Average
Thereafter clicking Moving Average we will find a box as below
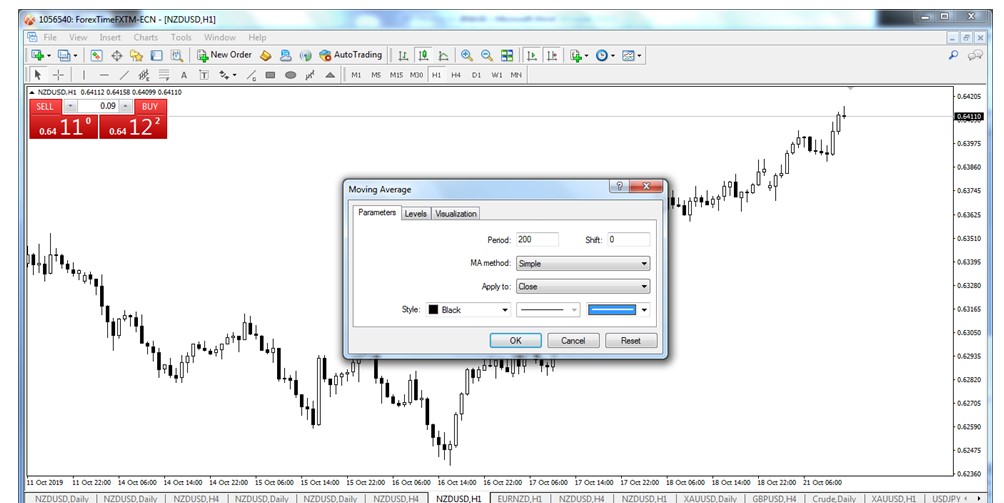
Image 2: Plotting 200 Simple Moving Average Indicator
Here we select Simple Moving Average. You can select Exponential, Smoothed, or Linear Weighted Moving Average.
But you don’t have to worry about which moving average is best or which moving average I will use.
I think there is nothing to worried because all types of moving average concepts are basically the same just calculations are slightly different.
It depends on your strategy and mental satisfaction.
Simple Moving Average & Exponential Moving Average is mostly used in 200 Moving Average strategies.
For your kind information, There is no need to change SHIFT and APPLY TO when you close in the Moving Average box.
After clicking OK inbox The 200 Moving Average chart looking as below in metatrader4
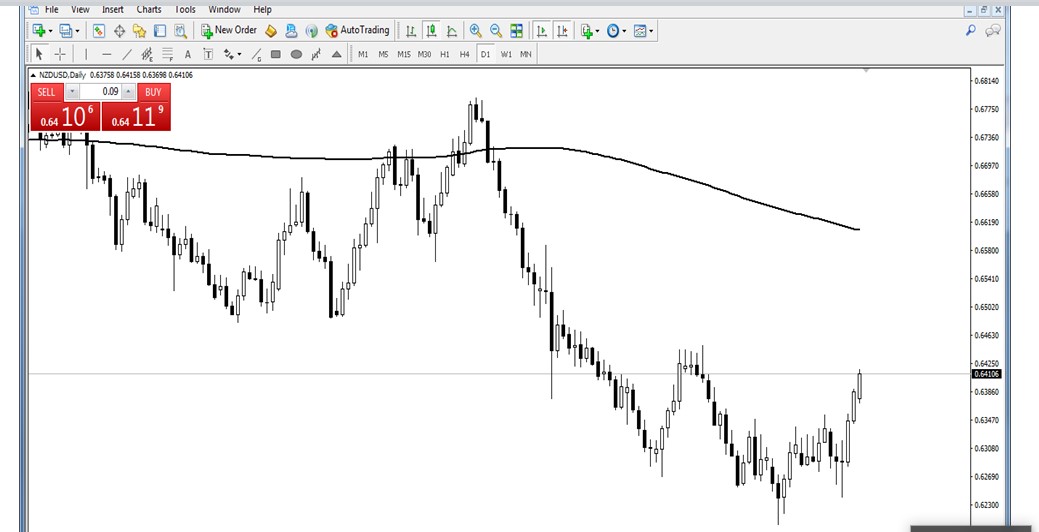
Image 3: Looks of 200 Day Moving Average Chart.
Let’s discover how candlesticks crossing 200 Moving Average with retest.
Without retest, any breakout has some doubt for a successful breakout.
There is two types of 200 Moving Average breakout retest.
- Slow Breakout Retest.
- Sharp Breakout Retest.
Slow Breakout Retest:
Slow breakout retest means price didn’t retest 200 moving average immediately.
Generally five to ten bull candlestick later price retest 200 moving average.
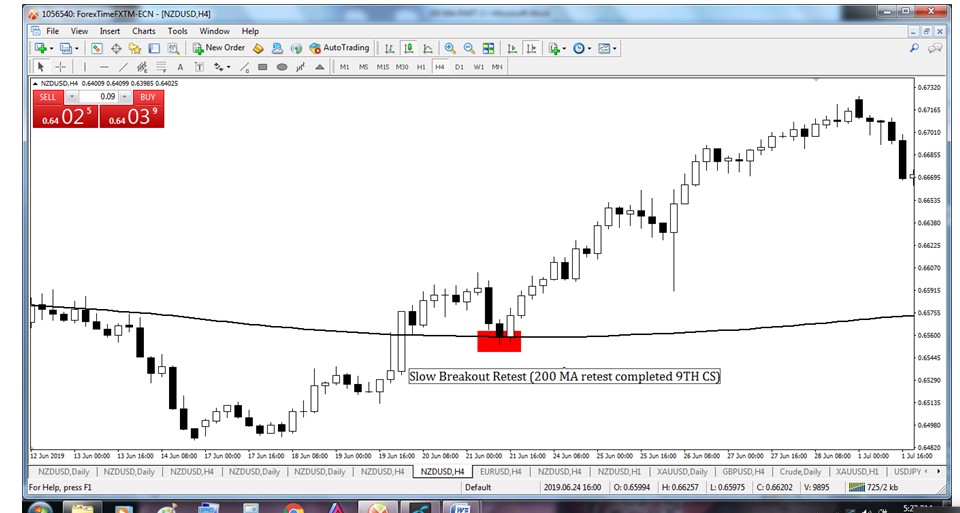
Image 4: Slow Breakout Retest (200 moving average retest completed after ninth candlesticks)
Vice versa, Generally five to ten bear candlestick later price retest 200 moving average.
Sharp Breakout Retest:
Sharp breakout retest means price retest 200 moving average immediately.
Generally two to four bull candlestick later price retest 200 moving average.
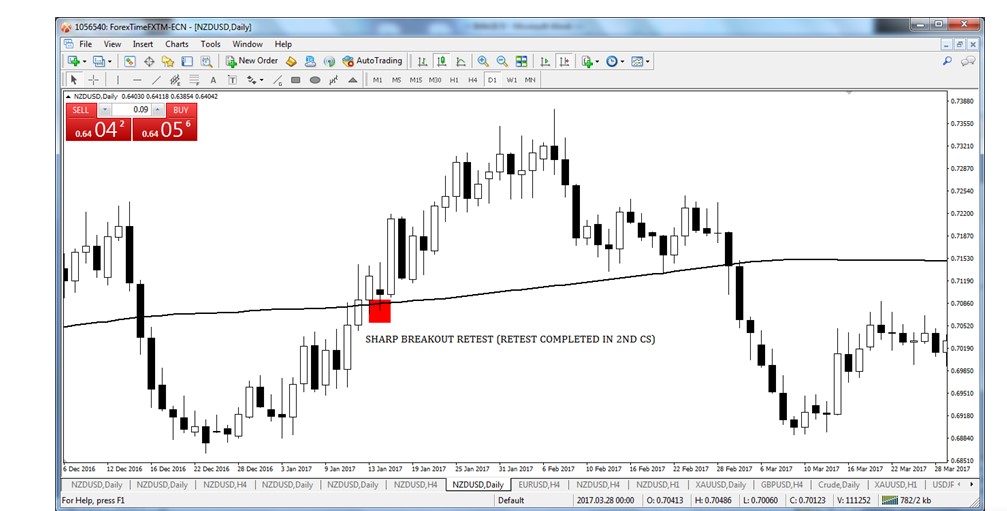
Image 5: Sharp Breakout Retest (2nd candlesticks completed retest 200 moving average)
Vice versa, Generally five to ten bear candlestick later price retest 200 moving average.
Now time to discover the 200 Moving Average bounce strategy.
There are many types of 200 Moving Average bounce.
- Retest Bounce
- Swing Bounce
Retest Bounce:
Suppose candlesticks are now below of 200 Moving Average.
That means it’s DOWN trend. The market is fully Bear control.
A little time later Bulls are trying to take control. At last, Bulls is in full control.
Candlesticks crossed 200 Moving Average. Thereafter Bulls lost her control for few times.
Bears are now the market leader. Price fall from Higher High and came near 200 Moving Average.
It’s called a retest of 200 Moving Average. Also, the price creates Lower Low.
Thereafter Bulls are taking control slowly and few time later prices create Higher High.
For your kind information, There is no holy grail strategy. So few time prices unable to complete retest and create Higher Low for extreme Bear pressure.
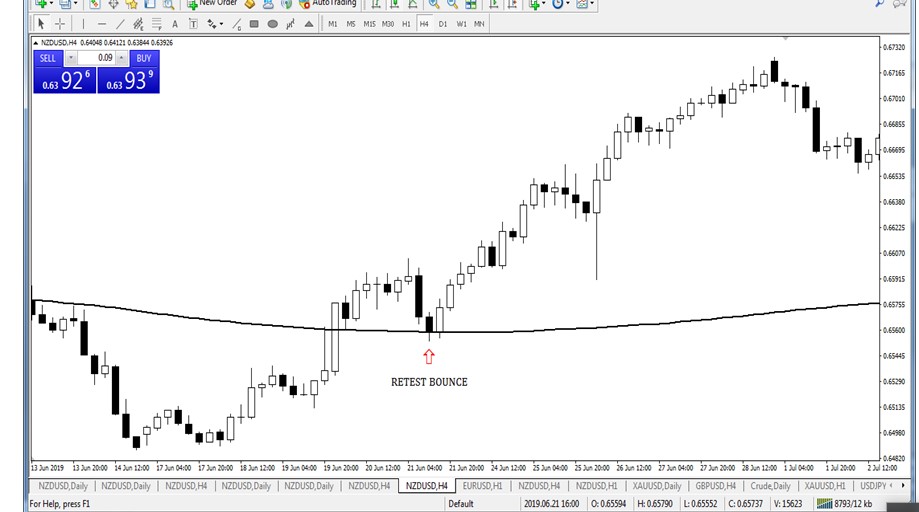
Image 6: Candlesticks create Retest Bounce from 200 Moving Average.
Let’s discover how we enter and exit by using 200 Moving Average Bounce Strategy
Buy:
We always find our BUY opportunity when candlesticks are above on 200 Moving Average.
Never buy below 200 Moving Average because 200 Moving Average broadly used by the institutional investor.
The institutional investor takes their investment decision through identify trends by using 200 Moving Average and others.
So when candlesticks are above on 200 Moving Average that means it’s an uptrend.
We know that TREND IS FRIEND. So it will be great foolishness if we go against the trend.
For BUY of 200 Moving Average Bounce Strategy, At first we check have price crossed 200 Moving Average sharply or slowly whatever.
Then wait for a retest on 200 Moving Average.
Thereafter wait for price action candlesticks pattern (PIN BAR, BULLISH ENGULFING, MORNING STAR, HAMMER, HARAMI, PIERCING, DOJI, etc.)
It will be great if there are any confluence levels when bouncing from 200 Moving Average.
Best confluence will be Daily, Weekly, and Monthly Support Resistance level or zone, Short, Mid, or Long term Trend line, Fibonacci and Pivot Point, etc.
Stop-Loss (SL): Stop loss will be five to ten pips below 200 Moving Average.
Take Profit (TP): Take Profit will be near resistance/swing high or 1:2 or 1:3 of risk-reward ratio.
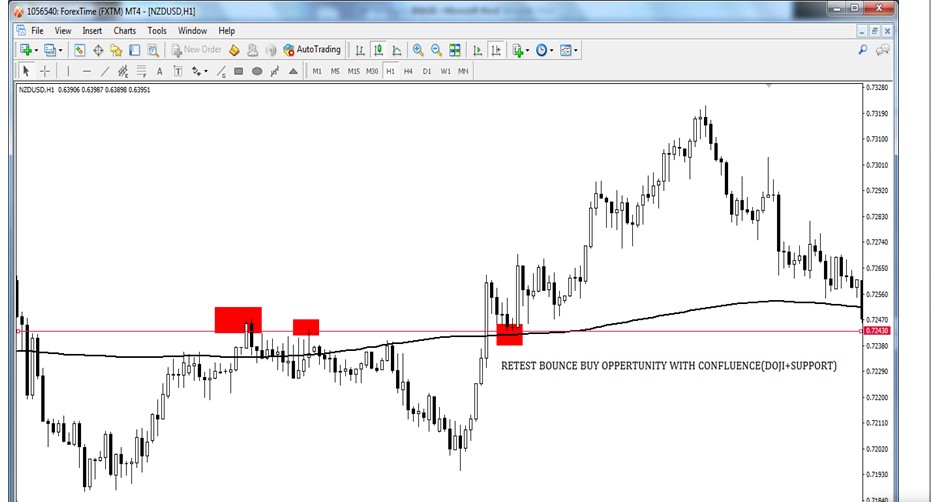
Image 7: 200 Moving Average Retest Bounce Buy Opportunity with Confluence (Doji + Support)
Sell:
We always find our SELL opportunity when candlesticks are below on 200 Moving Average.
Never sell below 200 Moving Average because 200 Moving Average broadly used by the institutional investor.
The institutional investor takes their investment decision through identify trends by using 200 Moving Average and others.
So when candlesticks are below on 200 Moving Average that means its a downtrend.
We know that TREND IS FRIEND. So it will be great foolishness if we go against the trend.
For SELL of 200 Moving Average Bounce Strategy, At first, we check price crossed 200 Moving Average sharply or slowly whatever.
Then wait for a retest on 200 Moving Average.
Thereafter wait for price action candlesticks pattern (PIN BAR, BEARISH ENGULFING, SHOOTING STAR, HARAMI, DARK CLOUD COVER, DOJI, etc.)
It will be great if there are any confluence levels when bouncing from 200 Moving Average.
Best confluence will Daily, Weekly, and Monthly Support Resistance level or zone, Short, Mid or Long term Trend line, Fibonacci and Pivot Point, etc.
Stop-Loss (SL): Stop loss will five to ten pips above 200 Moving Average.
Take Profit (TP): Take Profit will be near support or 1:2 or 1:3 of risk-reward ratio.

Image 8: 200 Moving Average Retest Bounce Sell Opportunity with Confluence (Pinbar + Resistance)
Swing Bounce:
Suppose price above 200 Moving Average from a certain time.
There are also a few Higher High above 200 Moving Average curves.
Suddenly any reason Bears take control. Price going down and down.
Thereafter Bulls are taking control when the price touches or near 200 Moving Average.
Because that’s moment 200 Moving Average attracts Buyer thus Bull are taking control.
Thereafter price creates Higher High and uptrend are still now intact.
For your kind information, As per 200 Moving Average rules uptrend means candlesticks must above the 200 Moving Average curve.
Vice versa, Suppose price below 200 Moving Average from a certain time.
There are also a few Lower Low below 200 Moving Average curves.
Suddenly any reason the Bulls take control. Price going up and up.
Thereafter Bears are taking control when the price touches or near 200 Moving Average.
Because that’s moment 200 Moving Average attract Seller thus Bear are taking control.
Thereafter price creates Lower Low and Downtrend are till now intact.
For your kind information, As per 200 Moving Average rules Downtrend means candlesticks must below the 200 Moving Average curve.
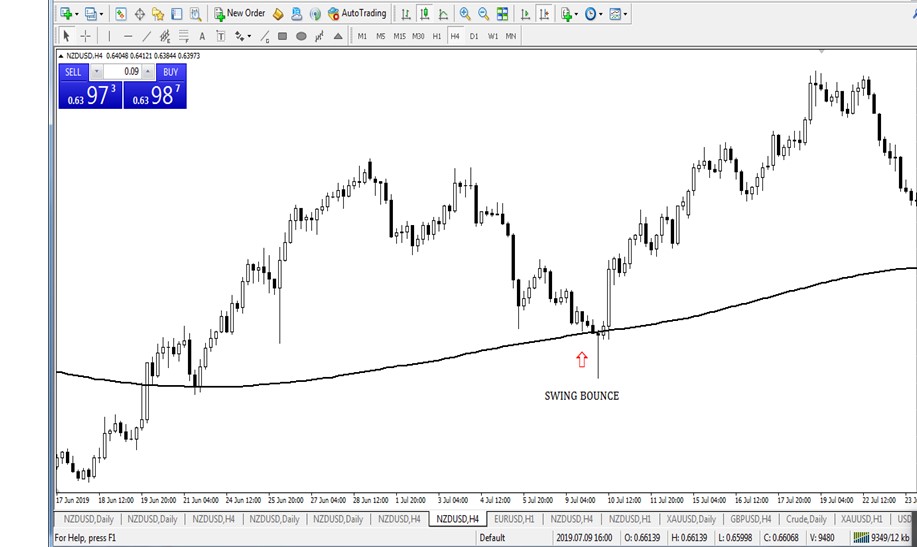
Image 9: Candlesticks create Swing Bounce from 200 Moving Average.
Swing Bounce Buy:
The price crossed 200 Moving Average previously.
There are also a few Higher High above on 200 Moving Average.
The price suddenly falls and came near or touch 200 Moving Average.
Then price increase with price action candlesticks (PIN BAR, BULLISH ENGULFING, MORNING STAR, HAMMER, HARAMI, PIERCING, DOJI, etc.) signal.
It will be great if there are any confluence levels when bouncing from 200 Moving Average.
Best confluence will Daily, Weekly, and Monthly Support Resistance level or zone, Short, Mid or Long term Trend line, Fibonacci and Pivot Point, etc.
Stop-Loss (SL): Stop loss will five to ten pips below 200 Moving Average
Take Profit (TP): Take Profit will be near resistance or 1:2 or 1:3 of risk-reward ratio.
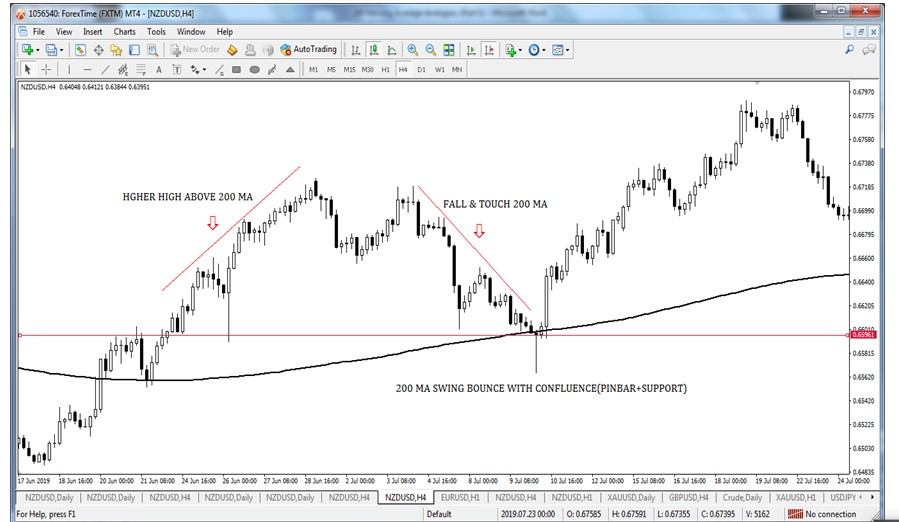
Image 10: 200 Moving Average Swing Bounce Buy Opportunity With Confluence (Pinbar + Support)
Swing Bounce Sell:
The price crossed 200 Moving Average previously. There are also a few Lower Rows below down 200 Moving Average.
The price suddenly up and came near or touch 200 Moving Average.
Then price decrease with price action candlesticks (PIN BAR, BULLISH ENGULFING, MORNING STAR, HAMMER, HARAMI, PIERCING, DOJI, etc.) signal.
It will be great if there are any confluence levels when bouncing from 200 Moving Average.
Best confluence will Daily, Weekly, and Monthly Support Resistance level or zone, Short, Mid or Long term Trend line, Fibonacci and Pivot Point, etc.
Stop-Loss (SL): Stop loss will five to ten pips above 200 Moving Average
Take Profit (TP): Take Profit will be near support or 1:2 or 1:3 of risk-reward ratio.

Image 11: 200 Moving Average Swing Bounce Sell Opportunity with Confluence (Pinbar + Support)
Hope a better idea has done to read this article.
In the next article, I shall explain how to Entry and Exit by using the Trend line to 200 Moving Average and how to Entry and Exit by using Ascending Triangle to 200 Moving Average.
Using Bollinger Bands to Gauge Trends


