 Earn Money Forex Best Forex Trading Experience

Bollinger Bands Strategies (Part-9)
Friends…….
A lot of thanks for visit earnmoneyfx.com
As a series part strategy of Bollinger bands Strategy, earnmoneyfx.com research team
suggests you to follow various type entry-exit strategies of Bollinger Brand as below:
1. Candlesticks Pattern with Bollinger bands
2. Double Top Chart Pattern with Bollinger bands
3. Double Bottom Chart Pattern with Bollinger bands
4. Reversal or Counter Candlesticks with Bollinger bands
5. Trend line Breakout with Bollinger bands
6. Swing Trading with Middle bands (20 Simple Moving Average) Bollinger bands
7. Walking with Bollinger bands
8. Ascending Triangle with Bollinger bands
9. Descending Triangle with Bollinger bands
10. Symmetrical Triangle with Bollinger bands
11. Flag Pattern with Bollinger bands
12. Channel with Bollinger Brand
13. Candlesticks Pattern with Bollinger bands
14. Golden Cross with Bollinger bands
15. Death Cross with Bollinger bands
16. Short term & Mid term moving average cross with Bollinger bands
17. Multi time frame analysis with Bollinger bands
18. 200 Simple Moving Average with Bollinger bands etc.
Bollinger bands Entry-Exit Strategy (Part -1) we have discussed about Candlesticks
Pattern with Bollinger bands and Double Top Chart Pattern with Bollinger Brand.
(Part -1) click hare
Above link is for your ready references.
Bollinger bands Entry-Exit Strategy (Part -2) we have discussed about Double Bottom
Chart Pattern with Bollinger bands and Reversal or Counter Candlesticks with
Bollinger bands
(Part -2) Click here
Above link is for your ready references.
Bollinger bands Entry-Exit Strategy (Part -3) we have discussed about Trend line
Breakout with Bollinger bands.
(Part -3) Click here
Above link is for your ready references.
Bollinger bands Entry-Exit Strategy (Part -4) we have discussed about Swing Trading with
Middle Brand (20 Simple Moving Average) Bollinger Brand.
(Part -4) Click here
Above link is for your ready references.
Bollinger bands Entry-Exit Strategy (Part -5) we have discussed about 200 Simple Moving
Average with Bollinger bands.
(Part -5) Click here
Above link is for your ready references.
Bollinger bands Entry-Exit Strategy (Part -6) we have discussed about Walking with
Bollinger bands.
(Part -6) Click here
Above link is for your ready references.
Bollinger bands Entry Exit Strategy (Part -7) we have discussed about Ascending Triangle
with Bollinger bands Entry-Exit Strategy, Descending Triangle with Bollinger bands
Entry-Exit Strategy and Symmetrical Triangle with Bollinger bands Entry-Exit
Strategy.
(Part -7) Click here
Above link is for your ready references.
(Part-8) Click here
Bollinger bands Entry-Exit Strategy (Part -8) we have discussed about Flag Pattern with
Bollinger bands Entry-Exit Strategy, Channel with Bollinger bands Entry-Exit
Strategy.
Above link is for your ready references.
If you missed all or anyone, Earnest request you to visit Bollinger bands Entry-Exit
Strategy (Part -1), Bollinger bands Entry-Exit Strategy (Part -2), Bollinger bands Entry-Exit
Strategy (Part -3), Bollinger bands Entry-Exit Strategy (Part -4), Bollinger bands Entry-Exit
Strategy (Part -5), Bollinger bands Entry-Exit Strategy (Part -6), Bollinger bands Entry-Exit
Strategy (Part -7) and Bollinger bands Entry-Exit Strategy (Part -8) in earnmoneyfx.com
These article earnmoneyfx.com research teams try to cover another strategy as below.
*** Golden Cross with Bollinger bands Entry-Exit Strategy ***
*** Death Cross with Bollinger bands Entry-Exit Strategy ***
As per earnmonreyfx.com research team demo test, this strategy works well any
timeframe and any pair.
For good success rate, we suggest you One Hourly, Four Hourly, Daily timeframe and major
pair (EURUSD, GBPUSD, AUDUSD, NZDUSD, USDCHF, USDCAD, USDJPY, EURJPY,
GBPJPY), XAUUSD, XAUEUR, CRUDE OIL, and S& P500
Let’s explore all ……….
For your soft reminder, Before enter the deep discussion about Bollinger bands strategy, its
important us to know what is Bollinger Brand and How to calculate Bollinger bands
What is Bollinger bands?
Bollinger Band was developed by John Bollinger. Bollinger bands® is a registered
trademark by John Bollinger.
Bollinger bands is very simple. It has three parts. Upper Brand, Middle Brand, and Lower
Brand.
Upper Brand and Lower Brand are volatility based bands. Volatility based on standard
deviation. By using standard deviation volatility increases and decrease. Usually, standard
deviation 2 set in the upper bands and lower bands
When volatility increases the band automatically widen and when volatility decreases the
band automatically contract.
Middle Brand is 20 Simple Moving Average. Simple Moving Average use the standard
deviation formula thus 20 Simple Moving Average use Bollinger band as a middle brand.
Calculation of Bollinger bands:
* Middle Band = 20-day simple moving average (SMA)
* Upper Band = 20-day SMA + (20-day standard deviation of price x 2)

Please note, Bollinger bands (20,2) is built-in setup by Jhon Bollinger. But it’s not
mandatory to set up by build. You can change as your choice. But one thing you have to
know that most of the trader setup Bollinger bands as a build-in thus its show buy or signal
similarly most of the trader. If you want to change build-in setup, at first you have to specialists
in Bollinger bands strategies. Otherwise more chance to hit stop loss. It will be best if you
with the crowd.
As per John Bollinger suggestion,
You can set standard deviation multiplier 2, where the simple moving average is 20 and
The standard deviation value is 20.
You can set standard deviation multiplier 2.1, where the simple moving average is 50 and
The standard deviation value is 50.
You can set standard deviation multiplier 1.9, where simple moving average is 10 and
The standard deviation value is 10.
How to set up Bollinger bands in Metatrader4:
Open Metatrader4 > Insert > Indicator > Trend > Bollinger Brand
Golden Cross and Death Cross:
Golden cross and Death cross are actually crossing above and below of two moving
averages. Before deep drive in Golden cross and Death cross at first, we have to know what
Moving Averages is and how Moving averages are structured. Let’s check below …..
Moving Average are various types. E.g. Simple Moving Average (SMA), Exponential Moving
Average (EMA), Smoothed Moving Average (SMMA), etc.
Simple Moving Average (SMA) and Exponential Moving Average (EMA) are most uses of
these strategies because of its easy to calculate and understand.
As per earnmonreyfx.com research team demo test, this strategy works well any
timeframe and any pair.
For good success rate, we suggest you One Hourly, Four Hourly, Daily timeframe and major
pair (EURUSD, GBPUSD, AUDUSD, NZDUSD, USDCHF, USDCAD, USDJPY, EURJPY, GBPJPY),
XAUUSD, XAUEUR, CRUDE OIL, and S& P500
Definition and Calculation of Simple Moving Average (SMA):
A simple moving average is formed by calculating the average price of a currency
over a specific number of periods.
Most moving averages are based on closing prices; for example, a 5-day simple moving
the average is the five-day sum of closing prices divided by five.
As its name implies, a moving average is an average that moves.
Old data is dropped as new data becomes available, causing the average to move along the
time scale.
The example below shows a 5-day moving average evolving over three days.
Daily Closing Prices: 11,12,13,14,15,16,17
First day of 5-day SMA: (11 + 12 + 13 + 14 + 15) / 5 = 13
Second day of 5-day SMA: (12 + 13 + 14 + 15 + 16) / 5 = 14
The first day of the moving average simply covers the last five days.
The second day of the moving average drops the first data point (11) and adds the new
data point (16).
The third day of the moving average continues by dropping the first data point (12) and
adding the new data point (17).
In the example above, prices gradually increase from 11 to 17 over a total of seven days.
Notice that the moving average also rises from 13 to 15 over a three-day calculation period.
Also, notice that each moving average value is just below the last price. For example, the
moving average for day one equals 13 and the last price is 15. Prices the prior four days
were lower and this causes the moving average to lag.
For your kind information, Any moving average strategy is trend trading system.
Moving Average work well when price is up trend or downtrend.
In a choppy or sideways market moving average strategies are unable to well.
So we always avoid using moving average strategies when markets are choppy or
sideways.
Otherwise its chance to hit stop loss more and more.
Simple Moving Average is a default indicator in Metatrader4 or Metatrader5.
Metatrader4 Simple Moving Average plot as below
Open Metatrader4> Insert> Indicator >Trend > Moving Average> Simple > OK
Important things,
We will take our BUY decision when the price is above 200 Simple Moving Average.
Also, We will take our SELL decision when the price is below 200 Simple Moving Average.
What is Exponential Moving Average (EMA)?
An exponential moving average (EMA) is a type of moving average (MA) that places a greater weight
and significance of the most recent data points.
The exponential moving average is also referred to as the exponentially weighted moving
average.
An exponentially weighted moving average reacts more significantly to recent price
changes than a simple moving average (SMA), which applies an equal weight to all
observations in the period.
Shortcut calculation of Exponential Moving Average (EMA):
Exponential Moving Average (EMA) = Price (T) X K + EMA (Y) X (1-k)
Where,
T= Today
Y= Yesterday
N= Number of Day in Exponential Moving Average
K= 2 / (N+1)
Don’t worry about Exponential Moving Average critical calculation.
Exponential Moving Average is default indicator in Metatrader4 or Metatrader5.
Metatrader4 Exponential Moving Average plot as below
Open Metatrader4 >Insert> Indicator> Trend >Moving Average> Exponential >OK
Important things,
We will take our BUY decision when the price is above 200 Exponential Moving Average.
Also, we will take our SELL decision when the price is below 200 Exponential Moving Average.
Golden Cross with Bollinger bands Entry-Exit Strategy:
Before exploring Golden Cross Entry-Exit Strategy at first we learn to know what is Golden
Cross.
What is Golden Cross: Few time world heavyweight news channel or newspaper (e.g. BBC,
CNN and BLOOMBERG) published breaking news that EURUSD created Golden Cross. After
this news market tries to creating new high and high. It’s specially BUY mood because of
Golden Cross.
Actually when Midterm Moving Average crosses Long Term Moving Averages from below
then the market creates a Golden Cross.
As very much simple, When 50 Simple Moving Average crosses 200 Simple Moving Average
from below its Golden Cross. You also can use Exponential Moving Average here.
Various types of Golden Cross Entry and Exit Strategy are practicing in the financial market.
Earnmoneyfx.com research team suggest you two most usable strategies which success
rate is eighty to ninety percent if you follow our instruction properly.
Those are
1. Various Entry and Exit Strategy when Golden Cross with Bollinger Brand.
2. Traders Action Zone (TAZ) Entry and Exit Strategy with Bollinger Band.
Let’s explore both…..
Image 1: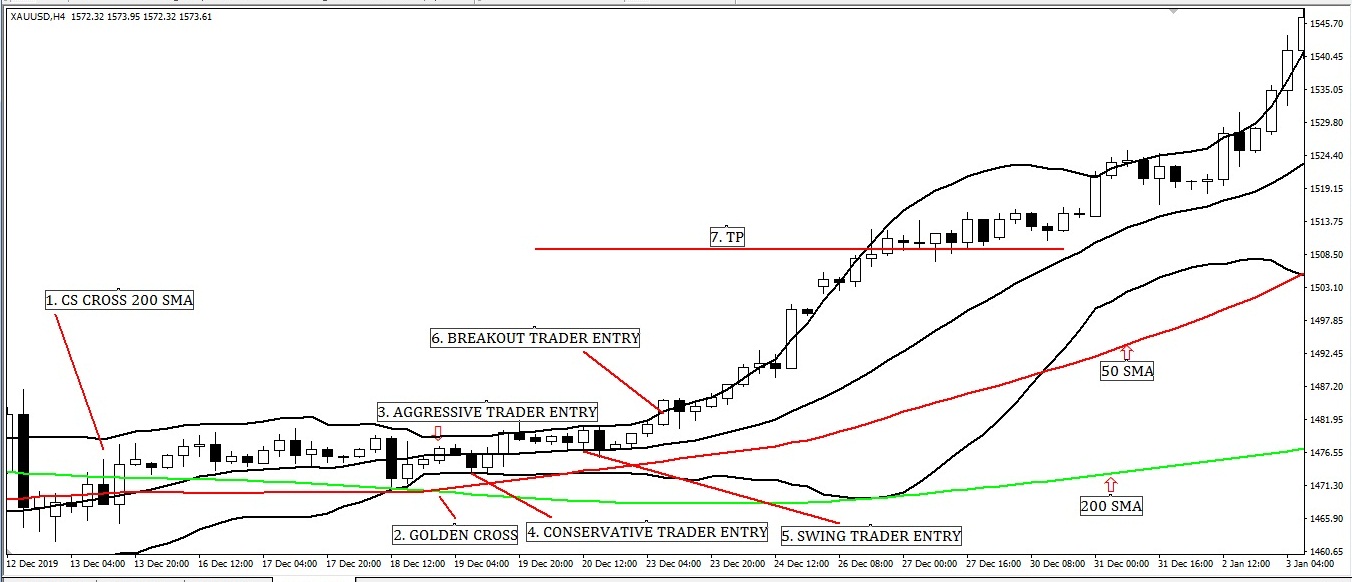
Various Entry and Exit Strategy when Golden Cross with Bollinger bands
Image point number – 1, We see candlesticks close above 200 Moving Average. That
means its uptrend. Also, its time to wait and watch as per various Entry and Exit Strategy
when Golden Cross.
Image point number – 2, Maintaining sideways above 200 Simple Moving Average where
candlesticks never close below 200 Simple Moving Average. Also never close below
Bollinger Lower Band. That means the price is till now bullish. We have to wait for Golden
Cross.
At last Golden Cross created. We hope that the price will go up massively.
Image point number – 3, Aggressive trader put their BUY STOP order 2 pips above of
Golden Crossing candlesticks.
After hit BUY STOP order aggressive trader place STOP LOSS 2 pips below of 50 Simple
Moving Average.
Image point number – 4, Bollinger Brand user Conservative trader put their BUY LIMIT
order with Bollinger Lower Brand.
After hit BUY LIMIT order Conservative trader place STOP LOSS 2 pips below of 50 Simple
Moving Average.
Image point number – 5, Bollinger Brand user Swing trader put their BUY LIMIT order
with Bollinger Middle Brand.
After hit BUY LIMIT order swing trader place STOP LOSS 2 pips below of 50 Simple Moving
Average or Bollinger Lower Brand which different more.
Image point number – 6, Bollinger Brand user Breakout trader put their BUY STOP order
Bollinger Upper Band breakout candlesticks.
After hit BUY STOP order breakout trader place STOP LOSS 2 pips below of 50 Simple
Moving Average or Bollinger Lower Brand which different more.
Image point number – 7, Conservative, aggressive swing and Breakout trader place their
take profit level on near swing high or 1: 2 or 1 : 3 risk-reward ratio.
Image 2: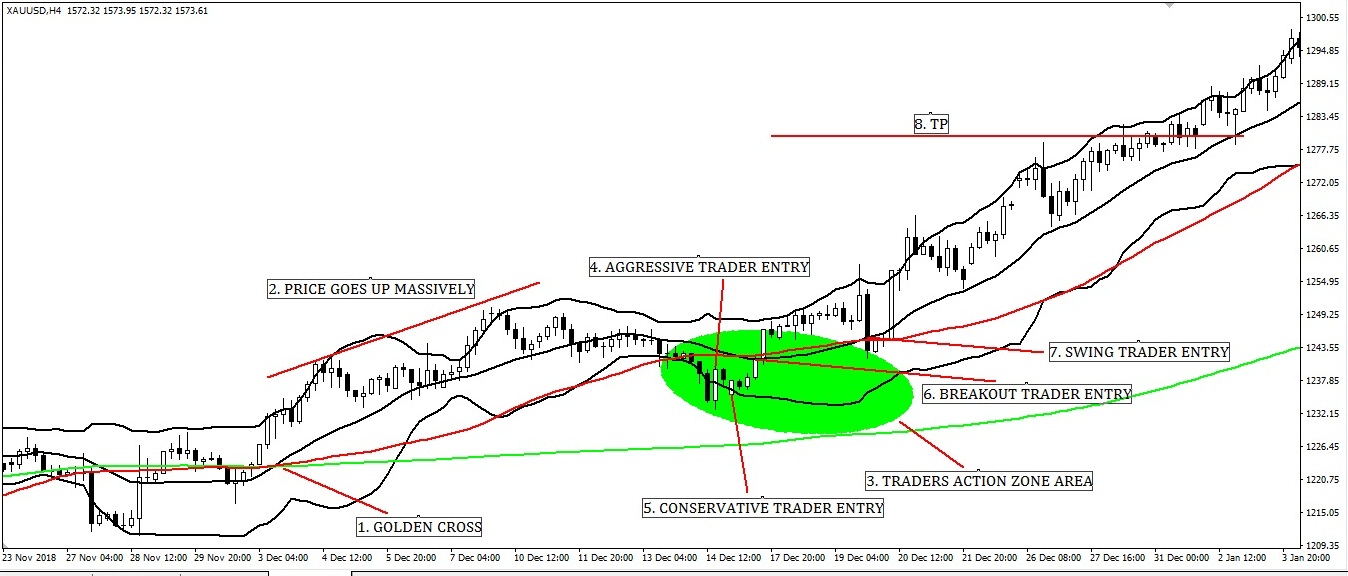
Traders Action Zone (TAZ) Entry and Exit Strategy with Bollinger bands.
What is Traders Action Zone (TAZ): Before exploring this strategy, at first we have to
know what Traders Action Zone (TAZ) is.
Traders Action Zone (TAZ) is actually this area of the chart where swing trader and pullback
trader take their position. Swing trader and pullback trader wait until price come Traders
Action Zone (TAZ).
Traders Action Zone (TAZ) area determined variously based on strategy,
This Golden Cross strategy Traders Action Zone (TAZ) is between 50 Simple Moving
Average and 200 Simple Moving Average until setup invalid.
Let’s explore….
Image point number – 1, We see candlesticks close above 200 Moving Average. That
means its uptrend. Also, its time to wait and watch as per Traders Action Zone (TAZ) Entry
and Exit Strategy.
Image point number – 2, After Golden Cross price goes up massively. But as per Traders
Action Zone (TAZ) Entry and Exit Strategy we have to wait until price comes back Traders
Action Zone (TAZ).
Image point number – 3, At last price come back in Traders Action Zone (TAZ). Now time
to Look for bullish price action reversal candlesticks pattern (PIN BAR, BULLISH
ENGULFING, MORNING STAR, HAMMER, HARAMI, PIERCING, DOJI, etc.)
Image point number – 4, Aggressive trader put their BUY STOP order 2 pips above of
reversal candlesticks.
After hit BUY STOP order aggressive trader place STOP LOSS 2 pips below of reversal
candlesticks.
Image point number – 5, Bollinger Brand user Conservative trader put their BUY LIMIT
order with Bollinger Lower Brand.
After hit BUY LIMIT order Conservative trader place STOP LOSS 2 pips below of 200 Simple
Moving Average.
Image point number – 6, Bollinger Brand user Breakout trader put their BUY STOP order
Bollinger Middle Brand breakout candlesticks.
After hit BUY STOP order Breakout trader place STOP LOSS 2 pips below of 200 Simple
Moving Average or Bollinger Lower Brand which different less.
Image point number – 7, Bollinger Brand user Swing trader put their BUY LIMIT order
with Bollinger Middle Brand.
After hit BUY LIMIT order Swing trader place STOP LOSS 2 pips below of 200 Simple
Moving Average or Bollinger Lower Brand which different less.
Image point number – 8, Conservative, aggressive swing and Breakout trader place their
take profit level on near swing high or 1: 2 or 1 : 3 risk-reward ratio.
Death Cross Entry-Exit Strategy with Bollinger bands:
Before exploring Death Cross Entry-Exit Strategy with Bollinger bands at first we learn to
know what is Death Cross.
What is Death Cross: Few time world heavyweight news channel or newspaper (e.g. BBC,
CNN and BLOOMBERG) published breaking news that EURUSD created Death Cross. After
this news market tries to creating new low and low. It’s specially SELL mood because of
Death Cross.
Actually when Midterm Moving Average crosses Long Term Moving Averages from up then
market create Death Cross.
As very much simple, When 50 Simple Moving Average crosses 200 Simple Moving Average
from up its Golden Cross. You also can use Exponential Moving Average here.
Various types of Death Cross Entry and Exit Strategy are practicing in the financial market.
Earnmoneyfx.com research team suggest you two most usable strategies which success
rate is eighty to ninety percent if you follow our instruction properly.
Those are….
1. Various Entry and Exit Strategy when Death Cross with Bollinger Brand.
2. Traders Action Zone (TAZ) Entry and Exit Strategy with Bollinger Brand.
Let’s explore both…..
Image 3: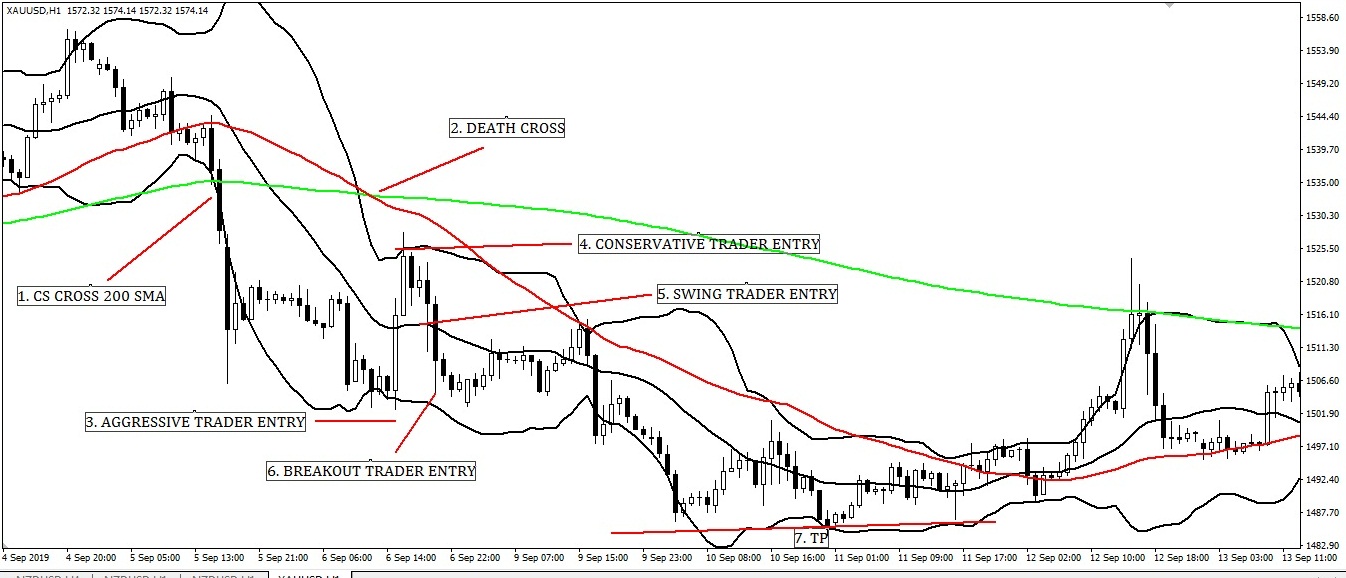
Various Entry and Exit Strategy when Death Cross with Bollinger bands.
Image point number – 1, We see candlesticks close below 200 Moving Average. That
means its down trend. Also its time to wait and watch as per various Entry and Exit
Strategy when Death Cross with Bollinger Brand.
Image point number – 2, Maintaining sideways below 200 Simple Moving Average where
candlesticks never close above 200 Simple Moving Average. Also never close above
Bollinger Upper Band. That means the price is till now bearish. We have to wait for Death
Cross.
At last Death Cross created. We hope that the price will go down massively.
Image point number – 3, Aggressive trader put their SELL STOP order 2 pips below of
Death Crossing candlesticks.
After hit SELL STOP order aggressive trader place STOP LOSS 2 pips above of 50 Simple
Moving Average.
Image point number – 4, Bollinger Brand user Conservative trader put their SELL LIMIT
order with Bollinger Upper Brand.
After hit SELL LIMIT order Conservative trader place STOP LOSS 2 pips above of 50 Simple
Moving Average.
Image point number – 5, Bollinger Brand user Swing trader put their SELL LIMIT order
with Bollinger Middle Brand.
After hit SELL LIMIT order swing trader place STOP LOSS 2 pips above of 50 Simple Moving
Average or Bollinger Upper Brand which different more.
Image point number – 6, Bollinger Brand user Breakout trader put their SELL STOP order
Bollinger Lower Brand breakout candlesticks.
After hit SELL STOP order breakout trader place STOP LOSS 2 pips above of 50 Simple
Moving Average or Bollinger Upper Brand which different more.
Image point number – 7,Conservative, aggressive swing and Breakout trader place their
take profit level on near swing Low or 1: 2 or 1 : 3 risk-reward ratio.
Image 4: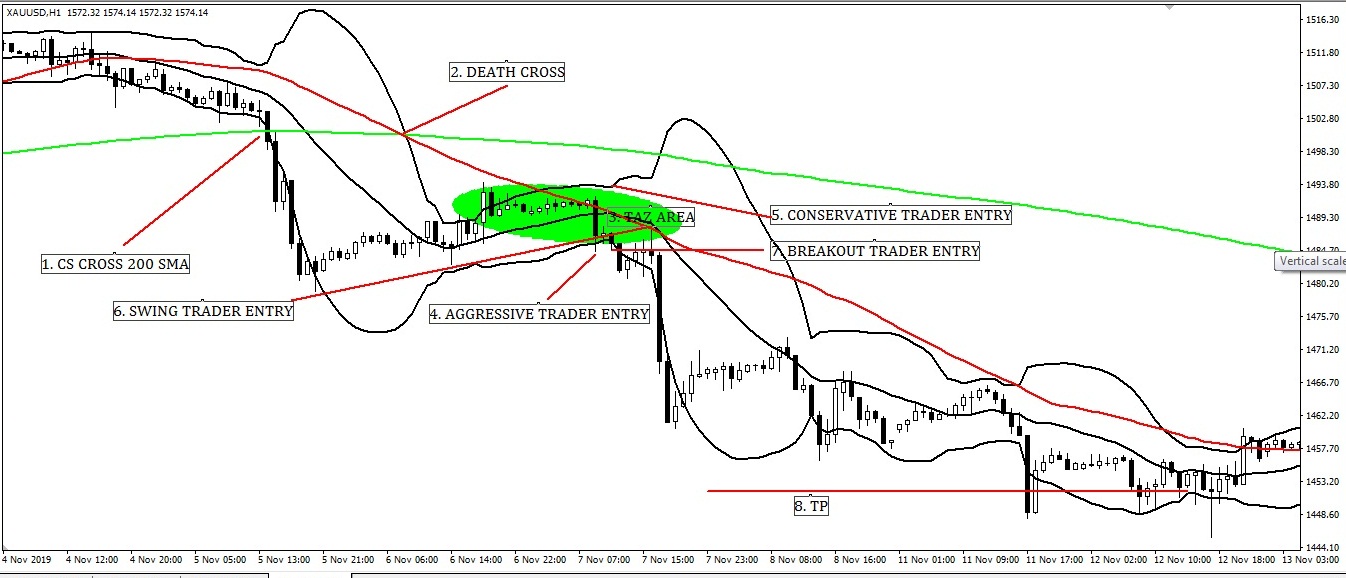
Traders Action Zone (TAZ) Entry and Exit Strategy with Bollinger bands.
Image point number – 1, We see candlesticks close below 200 Moving Average. That
means its downtrend. Also, its time to wait and watch as per Traders Action Zone (TAZ)
Entry and Exit Strategy.
Image point number – 2, After Death Cross price are sideways. But as per Traders Action
Zone (TAZ) Entry and Exit Strategy we have to wait until the price comes back Traders Action
Zone (TAZ).
Image point number – 3, At last price come back in Traders Action Zone (TAZ). Now time
to Look for bearish price action reversal candlesticks pattern (PIN BAR, BEARISH
ENGULFING, SHOOTING STAR, HARAMI, DARK CLOUD COVER, DOJI, etc.)
Image point number – 4, Aggressive trader put their SELL STOP order 2 pips below of
Death Crossing candlesticks.
After hit SELL STOP order aggressive trader place STOP LOSS 2 pips above of 50 Simple
Moving Average.
Image point number – 5, Bollinger Brand user Conservative trader put their SELL LIMIT
order with Bollinger Upper Brand.
After hit SELL LIMIT order Conservative trader place STOP LOSS 2 pips above of 50 Simple
Moving Average.
Image point number – 6, Bollinger Brand user Swing trader put their SELL LIMIT order
with Bollinger Middle Brand.
After hit SELL LIMIT order swing trader place STOP LOSS 2 pips above of 50 Simple Moving
Average or Bollinger Upper Brand which different more.
Image point number – 7, Bollinger Brand user Breakout trader put their SELL STOP order
Bollinger Lower Band breakout candlesticks.
After hit SELL STOP order breakout trader place STOP LOSS 2 pips above of 50 Simple
Moving Average or Bollinger Upper Brand which different more.
Image point number – 8, Conservative, aggressive swing and Breakout trader place their
take profit level on near swing Low or 1 : 2 or 1 : 3 risk-reward ratio.
——- Thanks for giving your valuable time to read this article ——–
(To be continued)


Sometimes I think it’s like looking in someone’s wallet through the comfort of
my own home. It is better to know rather than to spend years having
a pwrson since they lie and cheat. With the combination of the
stressed economy, and the electronic age, Investigatoirs are actually offering the
clientele the rented utilization of thhe GPS Vehicle Tracking devices.
It’s going to be end of mine day, but before finish I am reading this fantastic paragraph to improve my know-how.
Hey there! I could have sworn I’ve been to this site before but after checking through
some of the post I realized it’s new to me. Anyhow,
I’m definitely happy I found it and I’ll be bookmarking and checking back often!
I like the helpful info you provide for your articles.
I will bookmark your weblog and check once more
right here frequently. I’m somewhat certain I’ll be told plenty of new stuff
right right here! Best of luck for the next!
Attractive section of content. I just stumbled upon your web site and in accession capital
to assert that I acquire actually enjoyed account your blog posts.
Any way I’ll be subscribing to your feeds and even I achievement
you access consistently fast.
You could definitely see your expertise in the work you write.
The sector hopes for more passionate writers such as you who are not afraid to mention how they
believe. Always follow your heart.
Generally I do not learn article on blogs, but I would like to say that this write-up very forced me to take
a look at and do it! Your writing style has been surprised
me. Thank you, very nice post.
This is very interesting, You’re a very skilled blogger. I have joined your feed and look forward to seeking more
of your excellent post. Also, I’ve shared your website in my social
networks!
Everything is very open with a clear clarification of
the issues. It was definitely informative. Your website is extremely helpful.
Thanks for sharing!
This is very interesting, You’re a very skilled blogger.
I’ve joined your rss feed and look forward to seeking more of your great post.
Also, I have shared your web site in my social networks!
Remarkable things here. I am very glad to see your post.
Thank you a lot and I’m taking a look forward to touch you.
Will you please drop me a e-mail?
Hi there to every body, it’s my first pay a qyick visit of this website;
this blog contains awesome and genuinely excellent data for visitors.