 Earn Money Forex Best Forex Trading Experience


200 MOVING AVERAGE ALL STRATEGIES AT A GLANCE
Hello Friends……
Last few months we have published eight series of 200 Moving Average Strategy. For
you are easy to understand and apply, earnmoneyfx.com team presents all of 200
Moving Average Strategy summaries here.
Let’s start….
200 Moving Average Strategy. (Part -1)
Here we have discussed how entry and exit when combo with 200 Moving Average
and Support Resistance. The below link is for your detailed understanding.
200 Moving Average Strategy. (Part -1) Click here
Summery is below here……
IMAGE 1:
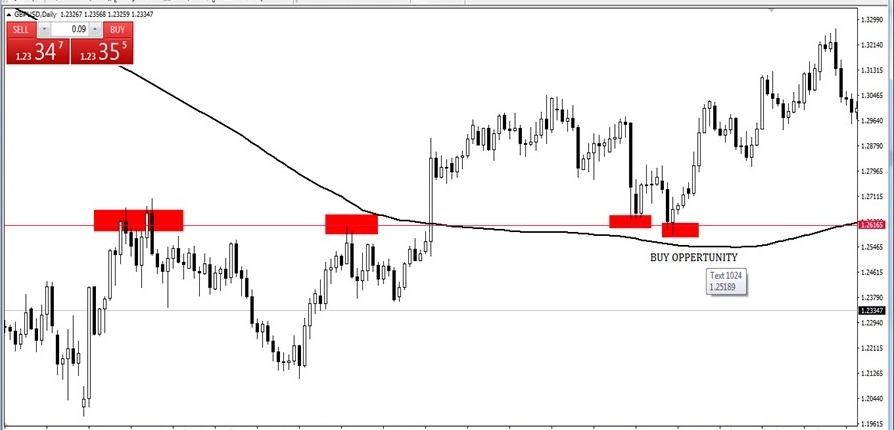
200 Moving Average and Support Resistance Entry-Exit Strategy (BUY)
At first, we have a focus on the 200 moving average curves. Are candlesticks cross 200
moving average?
If yes, then we have to identify the key support levels.
Thereafter waiting for candlesticks retest key support level.
If yes, then try to identify which type of candlesticks pattern is. Is it a price action
candlesticks pattern? e.g. (PIN BAR, BULLISH ENGULFING, MORNING STAR,
HAMMER, HARAMI, PIERCING, DOJI).
If yes anyone, we put our buy stop 2 pips above of the price action candlesticks
pattern high.
After hit buy stop order, we place our stop loss 2 pips below of price action
candlesticks pattern.
Also set take profit level near swing high or 1:2 or 1:3 of risk reward-ratio whatever
you like.
IMAGE 2:
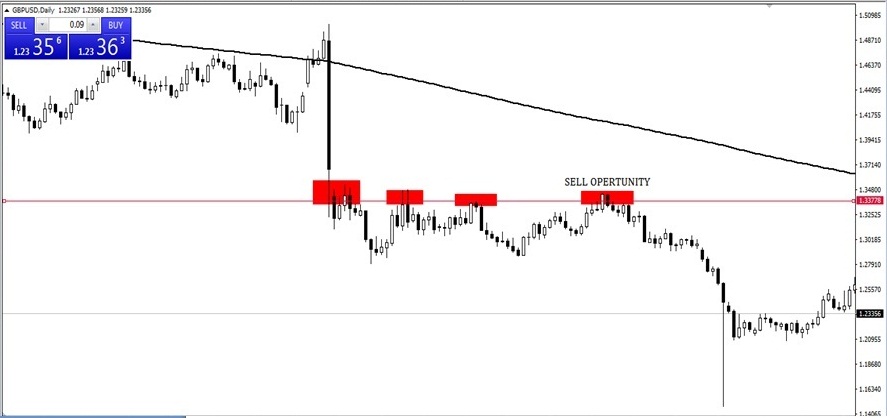
200 Moving Average and Support Resistance Entry-Exit Strategy (SELL)
At first, we have a focus on the 200 moving average curves. Are candlesticks cross 200
moving average?
If yes, then we have to identify the key resistance levels.
Thereafter waiting for candlesticks retest key resistance level.
If yes, then try to identify which type of candlesticks pattern is. Is it a price action
candlesticks pattern? e.g. (PIN BAR, BEARISH ENGULFING, SHOOTING STAR, HARAMI,
DARK CLOUD COVER, DOJI).
If yes anyone, we put our sell stop 2 pips below of the price action candlesticks
pattern low.
After hit sell stop order, we place our stop loss 2 pips above of price action
candlesticks pattern.
Also set take profit level near swing high or 1:2 or 1:3 of risk reward-ratio whatever
you like.
200 Moving Average Strategy. (Part- 2)
Here we have discussed how entry and exit 200 Moving Average bounce strategy. The
The below link is for your detailed understanding.
200 Moving Average Strategy. (Part- 2) Click here
Summery is below here……
IMAGE 3:
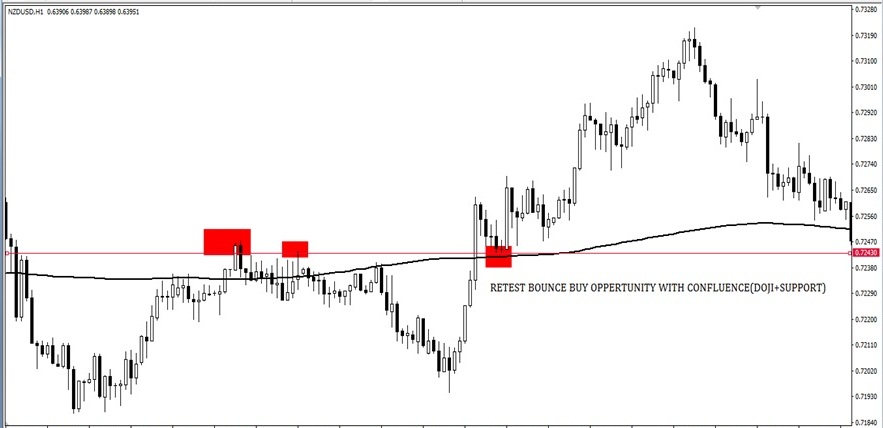
200 Moving Average retest, Support Resistance and Price action
candlesticks pattern Entry-Exit Strategy (BUY)
At first, we have a focus on the 200 moving average curve. Are candlesticks cross 200
moving average?
If yes, then we have to identify the key support levels.
Thereafter waiting for candlesticks retest 200 moving average and key support level.
If yes, then try to identify which type of candlesticks pattern is. Is it a price action
candlesticks pattern? e.g. (PIN BAR, BULLISH ENGULFING, MORNING STAR,
HAMMER, HARAMI, PIERCING, DOJI).
If yes anyone, we put our buy stop 2 pips above of the price action candlesticks
pattern high.
After hit buy stop order, we place our stop loss 2 pips below of price action
candlesticks pattern.
Also set take profit level near swing high or 1:2 or 1:3 of risk reward-ratio whatever
you like.
IMAGE 4:
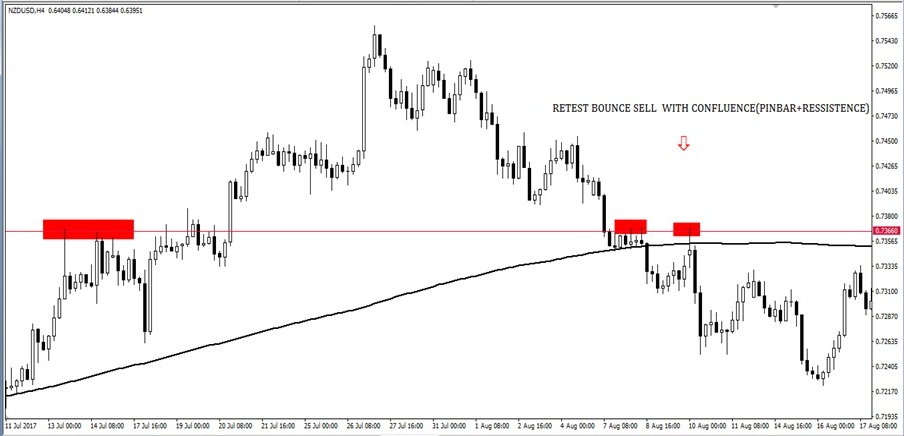
200 Moving Average retest, Support Resistance and Price action
candlesticks pattern Entry-Exit Strategy (SELL)
At first, we have a focus on the 200 moving average curves. Are candlesticks cross 200
moving average?
If yes, then we have to identify the key resistance levels.
Thereafter waiting for candlesticks retest 200 moving average and key resistance
level.
If yes, then try to identify which type of candlesticks pattern is. Is it a price action
candlesticks pattern? e.g. (PIN BAR, BEARISH ENGULFING, SHOOTING STAR, HARAMI,
DARK CLOUD COVER, DOJI).
If yes anyone, we put our sell stop 2 pips below of the price action candlesticks
pattern low.
After hit sell stop order, we place our stop loss 2 pips above of price action
candlesticks pattern.
Also set take profit level near swing high or 1:2 or 1:3 of risk reward-ratio whatever
you like.
IMAGE 5:
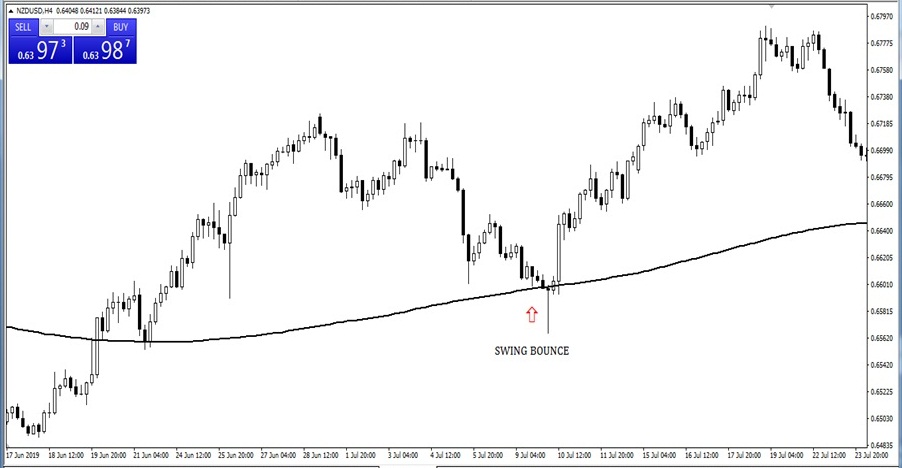
200 Moving Average Swing Bounce Entry-Exit Strategy (BUY)
At first, we have a focus on the 200 moving average curve. Are candlesticks cross 200
moving average?
A few times candlesticks create long-distance after crossed 200 moving average
without any immediate retest. This time we have nothing to do until candlesticks
create swing bounce.
If yes, then try to identify which type of candlesticks pattern is swing zone. Is it a price
action candlesticks pattern? e.g. (PIN BAR, BULLISH ENGULFING, MORNING STAR,
HAMMER, HARAMI, PIERCING, DOJI).
If yes anyone, we put our buy stop 2 pips above of the price action candlesticks
pattern high.
After hit buy stop order, we place our stop loss 2 pips below of price action
candlesticks pattern.
Also set take profit level near swing high or 1:2 or 1:3 of risk reward-ratio whatever
you like.
IMAGE 6:
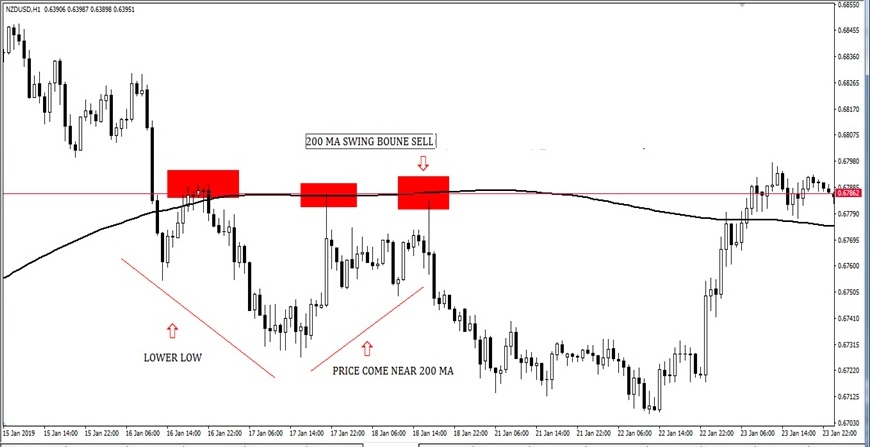
200 Moving Average Swing Bounce Entry-Exit Strategy (SELL)
At first, we have a focus on the 200 moving average curves. Are candlesticks cross 200
moving average?
A few times candlesticks create long-distance after crossed 200 moving average
without any immediate retest. This time we have nothing to do until candlesticks
create swing bounce.
If yes, then try to identify which type of candlesticks pattern is swing zone. Is it a price
action candlesticks pattern? e.g. (PIN BAR, BEARISH ENGULFING, SHOOTING STAR,
HARAMI, DARK CLOUD COVER, DOJI).
If yes anyone, we put our sell stop 2 pips below of the price action candlesticks
pattern low.
After hit sell stop order, we place our stop loss 2 pips above of price action
candlesticks pattern.
Also set take profit level near swing high or 1:2 or 1:3 of risk reward-ratio whatever
you like.
IMAGE 7:

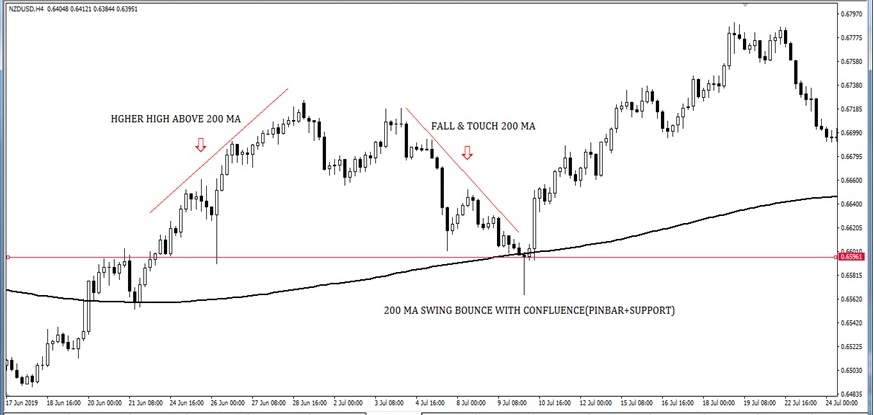
200 Moving Average Swing Bounce, Support Resistance and Price
action candlesticks pattern Entry-Exit Strategy (BUY)
At first, we have a focus on the 200 moving average curves. Are candlesticks cross 200
moving average?
If yes, then we have to identify the key support levels.
A few times candlesticks create long-distance after crossed 200 moving average
without any immediate retest. This time we have nothing to do until candlesticks
create swing bounce
Thereafter waiting for candlesticks retest 200 moving average and key support level.
If yes, then try to identify which type of candlesticks pattern is. Is it a price action
candlesticks pattern? e.g. (PIN BAR, BULLISH ENGULFING, MORNING STAR,
HAMMER, HARAMI, PIERCING, DOJI).
If yes anyone, we put our buy stop 2 pips above of the price action candlesticks
pattern high.
After hit buy stop order, we place our stop loss 2 pips below of price action
candlesticks pattern.
Also set take profit level near swing high or 1:2 or 1:3 of risk reward-ratio whatever
you like.
IMAGE 8:
200 Moving Average Swing Bounce, Support Resistance and Price
action candlesticks pattern Entry-Exit Strategy (SELL)
At first, we have a focus on the 200 moving average curves. Are candlesticks cross 200
moving average?
If yes, then we have to identify the key resistance levels.
A few times candlesticks create long-distance after crossed 200 moving average
without any immediate retest. This time we have nothing to do until candlesticks
create swing bounce
Thereafter waiting for candlesticks retest 200 moving average and key resistance
level.
If yes, then try to identify which type of candlesticks pattern is. Is it a price action
candlesticks pattern? e.g. (PIN BAR, BEARISH ENGULFING, SHOOTING STAR, HARAMI,
DARK CLOUD COVER, DOJI).
If yes anyone, we put our sell stop 2 pips below of the price action candlesticks
pattern low.
After hit sell stop order, we place our stop loss 2 pips above of price action
candlesticks pattern.
Also set take profit level near swing high or 1:2 or 1:3 of risk reward-ratio whatever
you like.
200 Moving Average Strategy. (Part- 3)
Here we have discussed how entry and exit 200 Moving Average with trend line. The
The below link is for your detailed understanding.
200 Moving Average Strategy. (Part- 3) Click here
Summery is below here……
IMAGE 9:
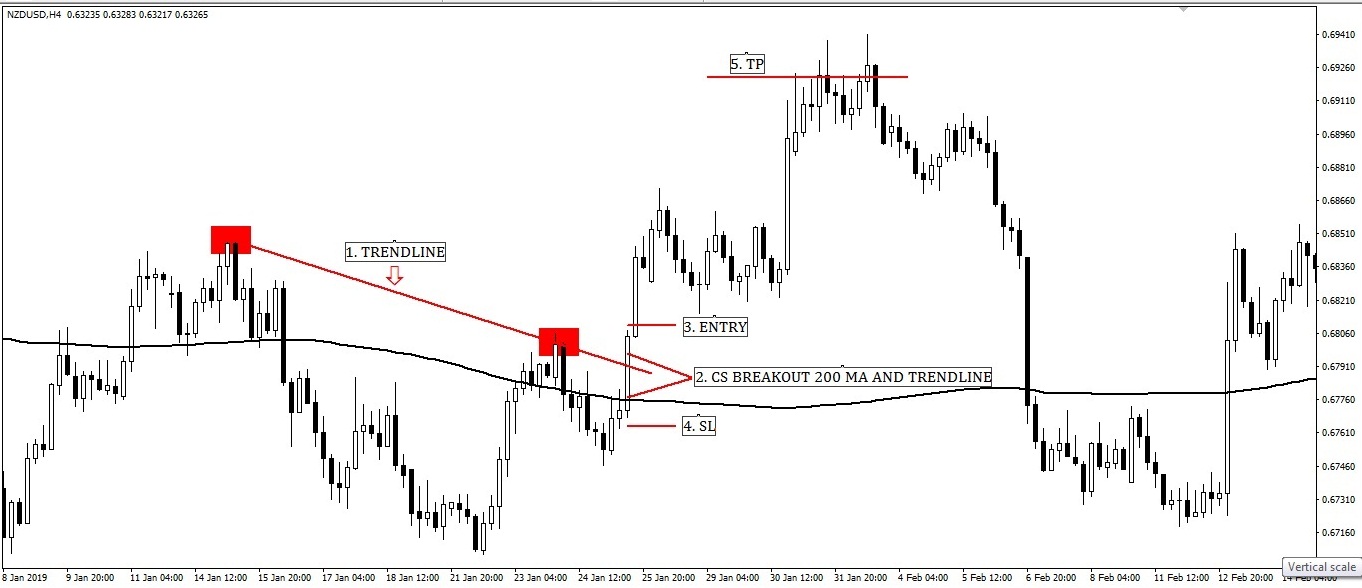
200 Moving Average with Trend Line Breakout Entry-Exit Strategy (BUY)
Image point number – 1, Price going strongly down with few swings. Connecting
two or more swing high, we complete drawing the trend line.
Image point number – 2, 200 Moving Average and Trend line both are the same time
breakout by candlesticks. It’s our signal candle for buy as per this rule.
Image point number – 3, Place BUY STOP order 2 pips above of 200 Moving Average
and Trend line break out candlesticks by the aggressive or conservative trader.
Image point number – 4, Put STOP-LOSS order by aggressive or conservative trader
2 pips below of 200 Moving Average and trend line breakout candlesticks after hit
BUY STOP order. Some most conservative traders place STOP LOSS 2 pips below of
200 Moving Average.
Image point number – 5, Put take profit level on the near swing high or 1: 2 or 1 : 3 risk-
reward ratio by the conservative or aggressive trader.
IMAGE 10:
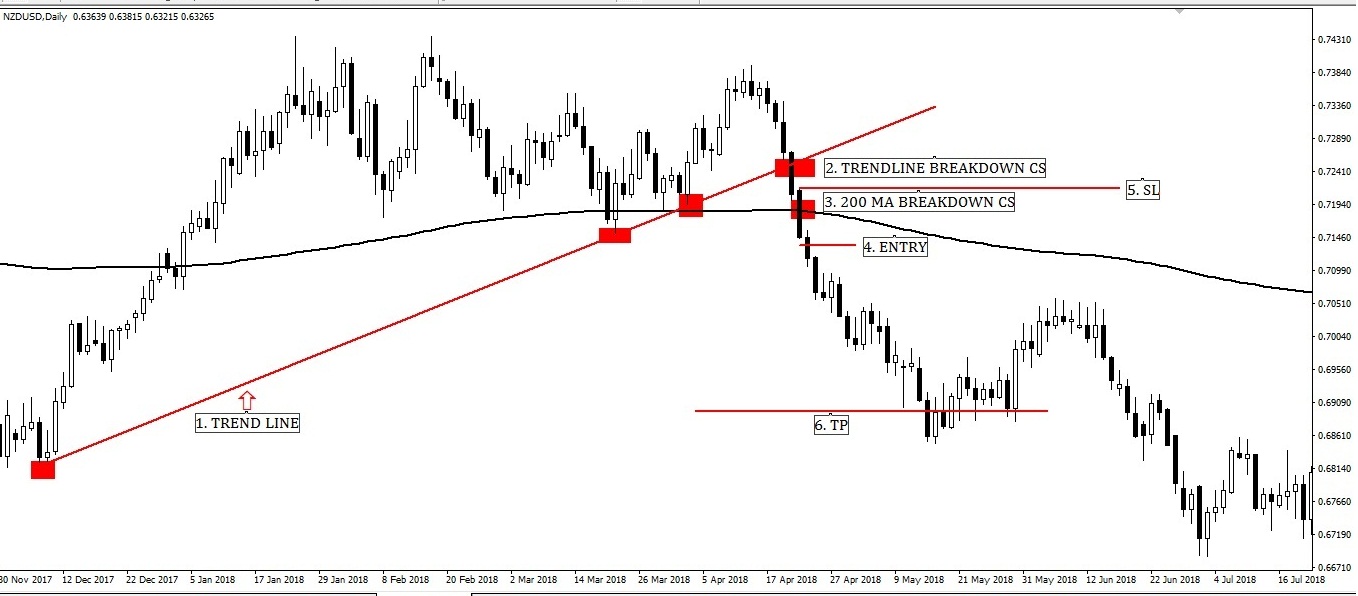
200 Moving Average with Trend Line Breakout Entry-Exit Strategy (SELL)
Image point number – 1, Price going strongly down with few swings.
Image point number – 2, Trend line breaks down by candlesticks. But don’t hurry to
enter here. 200 Moving Average is our main focus. Sale above 200 Moving Average
will be great foolishness. So its time to wait for candlesticks breaks down 200 Moving
Average.
Image point number – 3, 200 Moving Average breakouts by candlesticks. It’s our
signal candle for buy as per this rule.
Image point number – 4, Place SELL STOP order 2 pips above of 200 Moving
Average and Trend line break out candlesticks by the aggressive or conservative
trader.
Image point number – 5, Put STOP-LOSS order by aggressive or conservative trader
2 pips above of 200 Moving Average breakout candlesticks after hit BUY STOP order.
Some most conservative traders place STOP LOSS 2 pips above 200 Moving Average.
Image point number – 6, Put take profit level on the near swing low or 1: 2 or 1 : 3
the risk-reward ratio by the conservative or aggressive trader.
Image 11:
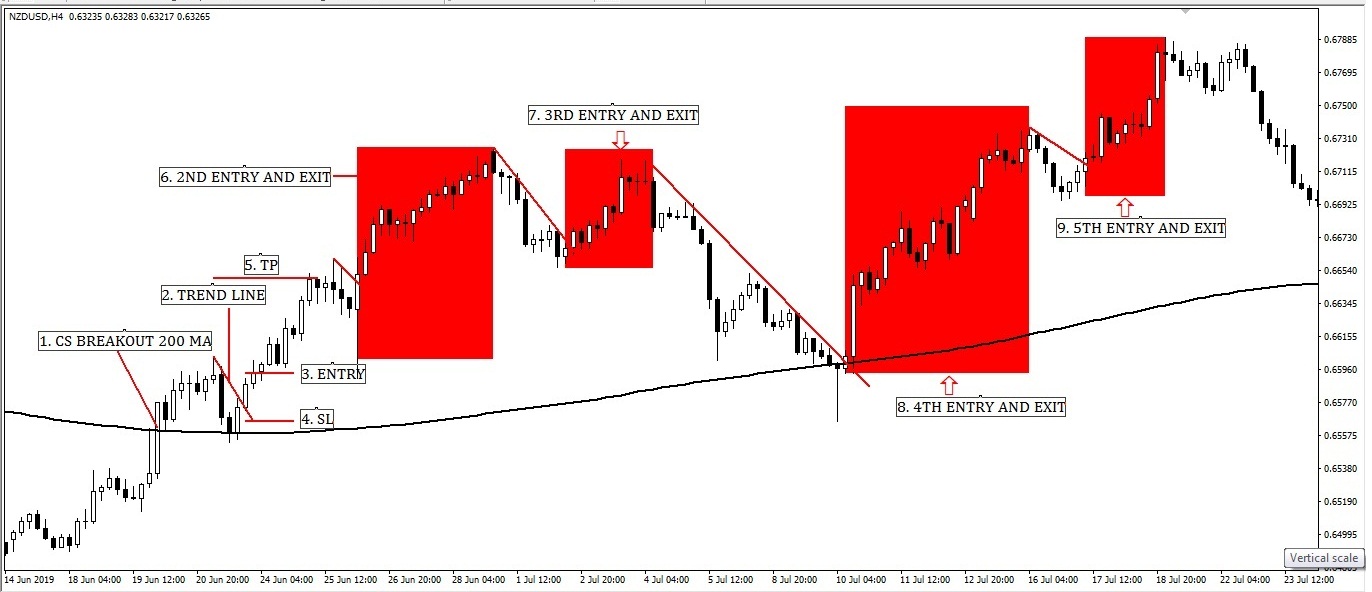
200 Moving Average and Trend Line Breakout Swing Entry-Exit Strategy (BUY)
Image point number – 1, 200 Moving Average breakouts by Candlesticks. No need
enter hurry until candlesticks breakout trend line.
Image point number – 2, Connecting two or more swing high, we complete drawing
trend line.
Image point number – 3, Place BUY STOP order 2 pips above Trend line break out
candlesticks by the aggressive or conservative trader.
Image point number – 4, Put STOP-LOSS order by aggressive or conservative trader
2 pips below trend line breakout candlesticks after hit BUY STOP order.
Image point number – 5, Put take profit level on the near swing high or 1 : 2 or 1 : 3
the risk-reward ratio by the conservative or aggressive trader.
Image point number – 6, 7, 8, and 9, There are more and more entry and exit scope
as per rules.
Image 12:
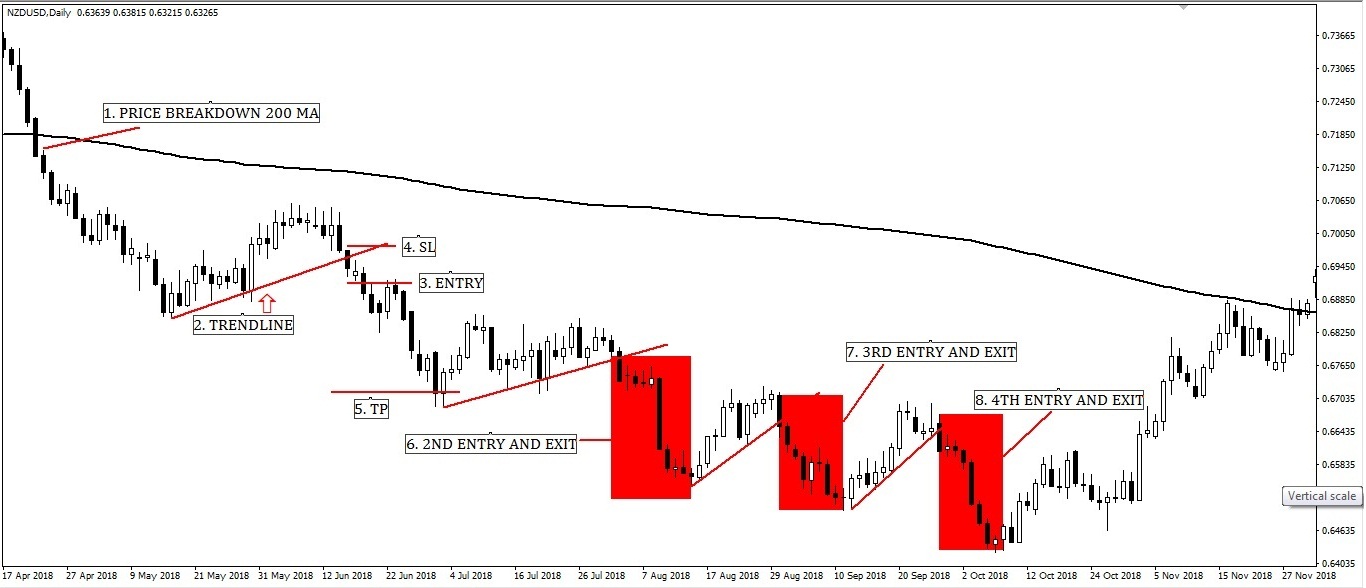
200 Moving Average and Trend Line Break Down Swing Entry-Exit Strategy (SELL)
Image point number – 1, 200 Moving Average breakouts by Candlesticks. No need
enter hurry until candlesticks breakout trend line.
Image point number – 2, Connecting two or more swing low, we complete drawing
trend line.
Image point number – 3, Place SELL STOP order 2 pips below Trend line break out
candlesticks by the aggressive or conservative trader.
Image point number – 4, Put STOP-LOSS order by aggressive or conservative trader
2 pips above trend line breakout candlesticks after hit BUY STOP order.
Image point number – 5, Put take profit level on the near swing low or 1 : 2 or 1 : 3
the risk-reward ratio by the conservative or aggressive trader.
Image point number – 6, 7, and 8, There are more and more entry and exit scope as
per rules.
200 Moving Average Strategy. (Part- 4)
Here we have discussed how entry and exit 200 Moving Average with Triangle
Pattern. The below link is for your detailed understanding.
200 Moving Average Strategy. (Part- 4) Click here
Summery is below here……
Image 13:
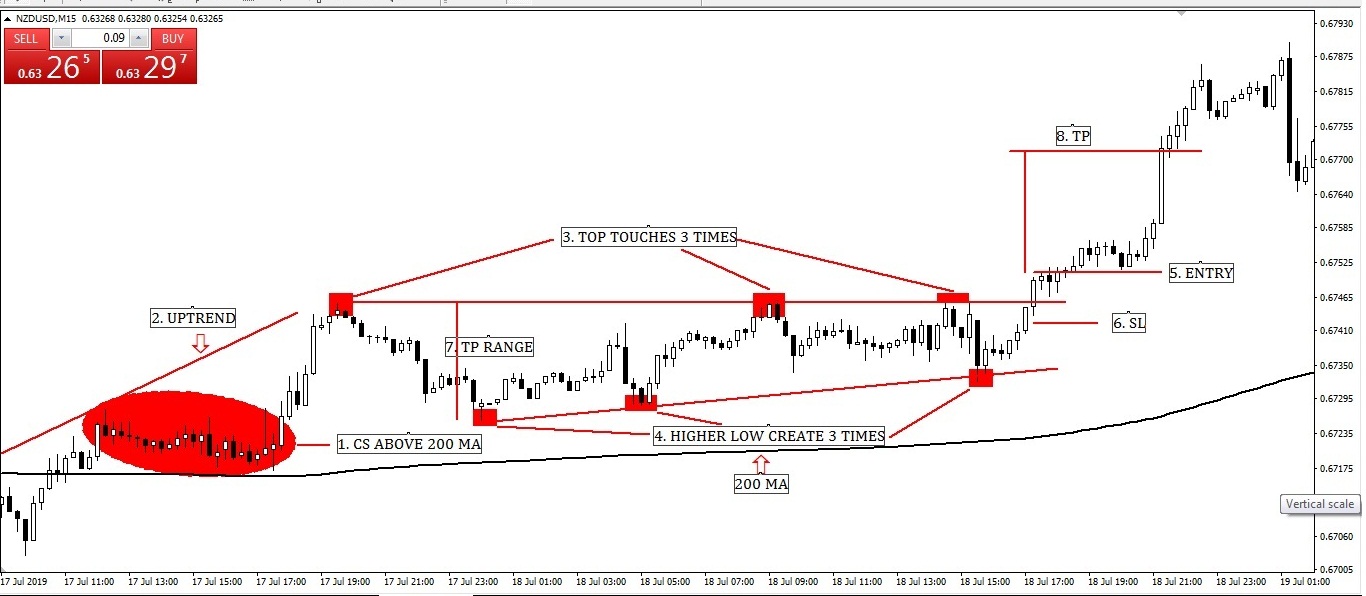
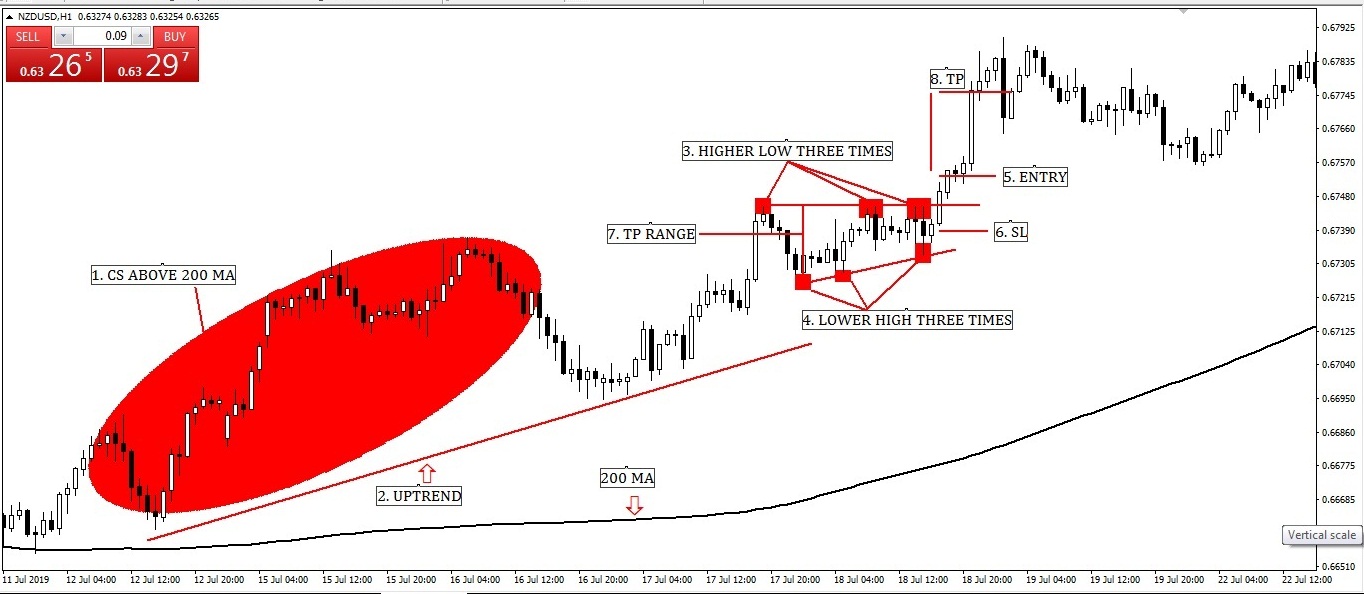
200 Moving Average and Ascending Triangle combo Entry-Exit Strategy
Image point number – 1, Candlesticks are above 200 Moving Average which means
its uptrend.
Image point number – 2, Already create a few higher-high which means the price is
strong uptrend now.
Image point number – 3, Price never up or down straight. As expected price has
gone to correction. Already touches three times in previous high but failure to
breakout.
Image point number – 4, Also the price created three higher low. That chart clearly
indicates its ascending triangle. As per rules, we have to wait for the breakout.
Image point number – 5, Place BUY STOP order 2 pips above ascending triangle
break out candlesticks by the aggressive or conservative trader.
Image point number – 6, Put STOP-LOSS order by aggressive or conservative trader
2 pips below ascending triangle breakout candlesticks after hit BUY STOP order.
Where STOP LOSS place 2 pips below of ascending triangle lower channel by
conservative traders.
Image point number – 7, Lets measure take profit range as per ascending triangle
exit rules.
Image point number – 8, Put take profit level on ascending triangle take profit range
or near swing high or 1: 2 or 1 : 3 risk-reward ratio by the conservative or aggressive
trader.
Image 14:

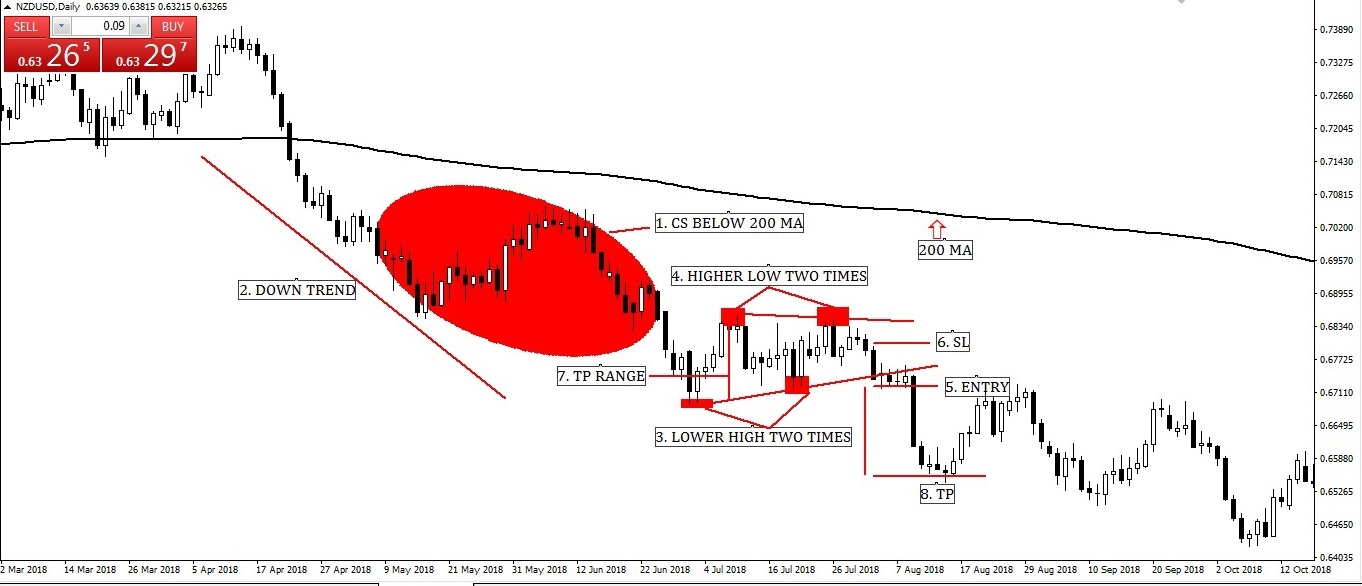
200 Moving Average and Descending Triangle combo Entry-Exit Strategy
Image point number – 1, Candlesticks are below 200 Moving Average which means
its downtrend.
Image point number – 2, Already create a few lower low which means the price is
strong downtrend now.
Image point number – 3, Price never up or down straight. As expected price has
gone to reversal. Already touches two times in previous low but failure to breakout.
Image point number – 4, Also the price created four times lower high. That chart
clearly indicates its descending triangle. As per rules, we have to wait for the breakout.
Image point number – 5, Place SELL STOP order 2 pips below descending triangle
break out candlesticks by the aggressive or conservative trader.
Image point number – 6, Put STOP-LOSS order by aggressive or conservative trader
2 pips above descending triangle breakout candlesticks after hit SELL STOP order.
Where STOP LOSS place 2 pips above of descending triangle lower channel by
conservative traders.
Image point number – 7, Lets measure take profit range as per descending triangle
exit rules.
Image point number – 8, Put take profit level on descending triangle take profit
range or near swing high or 1: 2 or 1 : 3 risk-reward ratio by the conservative or
aggressive trader.
Image 15:
200 Moving Average and Symmetrical Triangle combo Entry-Exit Strategy. (BUY)
Image point number – 1, Candlesticks are above 200 Moving Average which means
its uptrend.
Image point number – 2, Already create a few higher-high which means the price is
strong uptrend now.
Image point number – 3, Price never up or down straight. As expected price has
gone to correction. Already touches three times higher low which means its
indecision.
Image point number – 4, Also the price created three lower high which means the trend
is a pause now. That chart clearly indicates its symmetrical triangle. As per rules, we
have to wait for the breakout.
Image point number – 5, Place BUY STOP order 2 pips above the symmetrical triangle
break out candlesticks by the aggressive or conservative trader.
Image point number – 6, Put STOP-LOSS order by aggressive or conservative trader
2 pips below symmetrical triangle breakout candlesticks after hit BUY STOP order.
Where STOP LOSS place 2 pips below of symmetrical triangle lower channel by
conservative traders.
Image point number – 7, Lets measure take profit range as per symmetrical triangle
exit rules.
Image point number – 8, Put take profit level on symmetrical triangle take profit
range or near swing high or 1: 2 or 1 : 3 risk-reward ratio by the conservative or
aggressive trader.
Image 16:
200 Moving Average and Symmetrical Triangle combo Entry-Exit Strategy. (SELL)
Image point number – 1, Candlesticks are below 200 Moving Average which means
its downtrend.
Image point number – 2, Already create a few lower low which means the price is
strong downtrend now.
Image point number – 3, Price never up or down straight. As expected price has
gone to reversal. Already touches two times lower high which means its indecision.
Image point number – 4, Also the price created two times higher low which means
the trend is a pause now. That chart clearly indicates its symmetrical triangle. As per rules,
we have to wait for the breakout.
Image point number – 5, Place SELL STOP order 2 pips below the symmetrical triangle
break out candlesticks by the aggressive or conservative trader.
Image point number – 6, Put STOP-LOSS order by aggressive or conservative trader
2 pips above symmetrical triangle breakout candlesticks after hit SELL STOP order.
Where STOP LOSS place 2 pips above of symmetrical triangle lower channel by
conservative traders.
Image point number – 7, Lets measure take profit range as per symmetrical triangle
exit rules.
Image point number – 8, Put take profit level on symmetrical triangle take profit
range or near swing low or 1: 2 or 1 : 3 risk-reward ratio by the conservative or
aggressive trader.
200 Moving Average Strategy. (Part- 5)
Here we have discussed how entry and exit 200 Moving Average with Flag Pattern
and Channel. The below link is for your detailed understanding.
200 Moving Average Strategy. (Part- 5) Click here
Summery is below here……
Image 17:
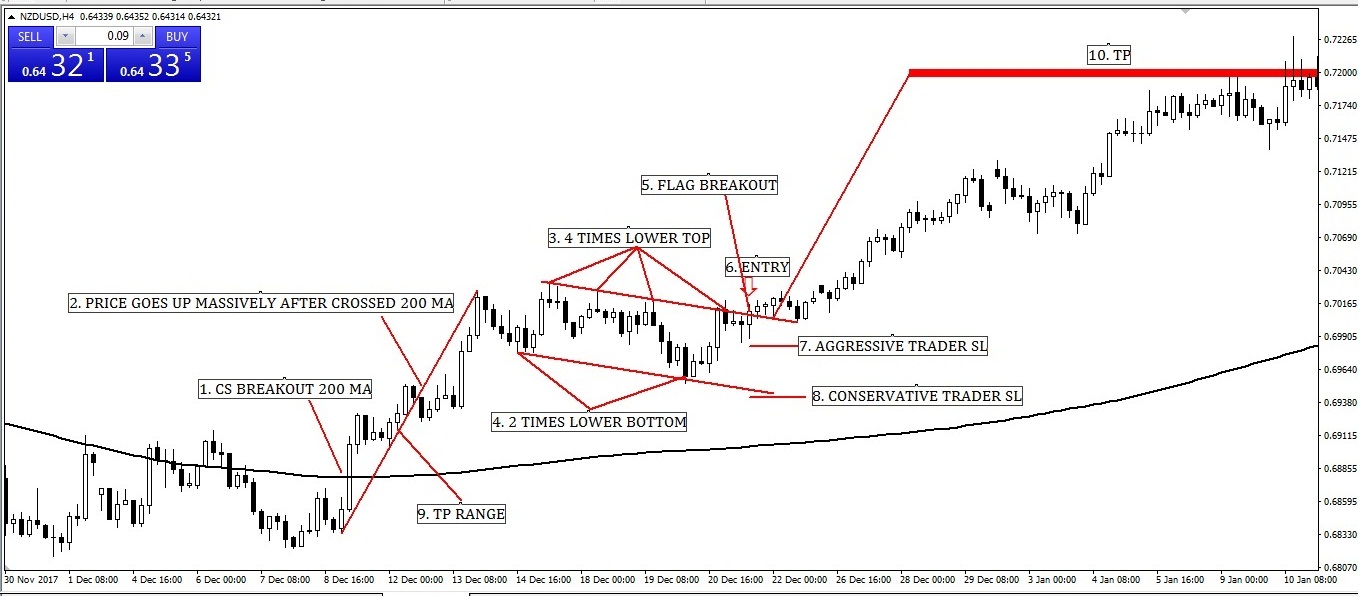
200 Moving Average and Bullish Flag Pattern Entry-Exit Strategy
Image point number – 1, Candlesticks are above 200 Moving Average which means
its uptrend.
Image point number – 2, Already create a few higher-high which means the price is
strong uptrend now.
Image point number – 3, Price never up or down straight. As expected price has
gone to correction. Already create three times lower tops but no breakouts happened.
Image point number – 4, Also the price created two times lower bottom. That chart
indicates its bullish flag pattern. As per rules, we have to wait for the breakout.
Image point number – 5, At last, bullish flag pattern breakouts. As per Bullish Flag
Pattern with 200 Moving Average Entry-Exit Strategy rules its time to buy when
candlesticks close above pattern which indicates a successful breakout.
Image point number – 6, Place BUY STOP order 2 pips above bullish flag pattern
break out candlesticks by the aggressive or conservative trader.
Image point number – 7, Put STOP-LOSS order by aggressive trader 2 pips below
bullish flag pattern breakout candlesticks after hit BUY STOP order.
Image point number – 8, Where STOP LOSS place 2 pips below of bullish flag pattern
lower pattern by conservative traders.
Image point number – 9, Lets measure take profit range as per bullish flag pattern
exit rules.
Image point number – 10, Put take profit level on bullish flag pattern take profit
range or near swing high or 1 : 2 or 1 : 3 risk-reward ratio by the conservative or
aggressive trader.
Image 18:
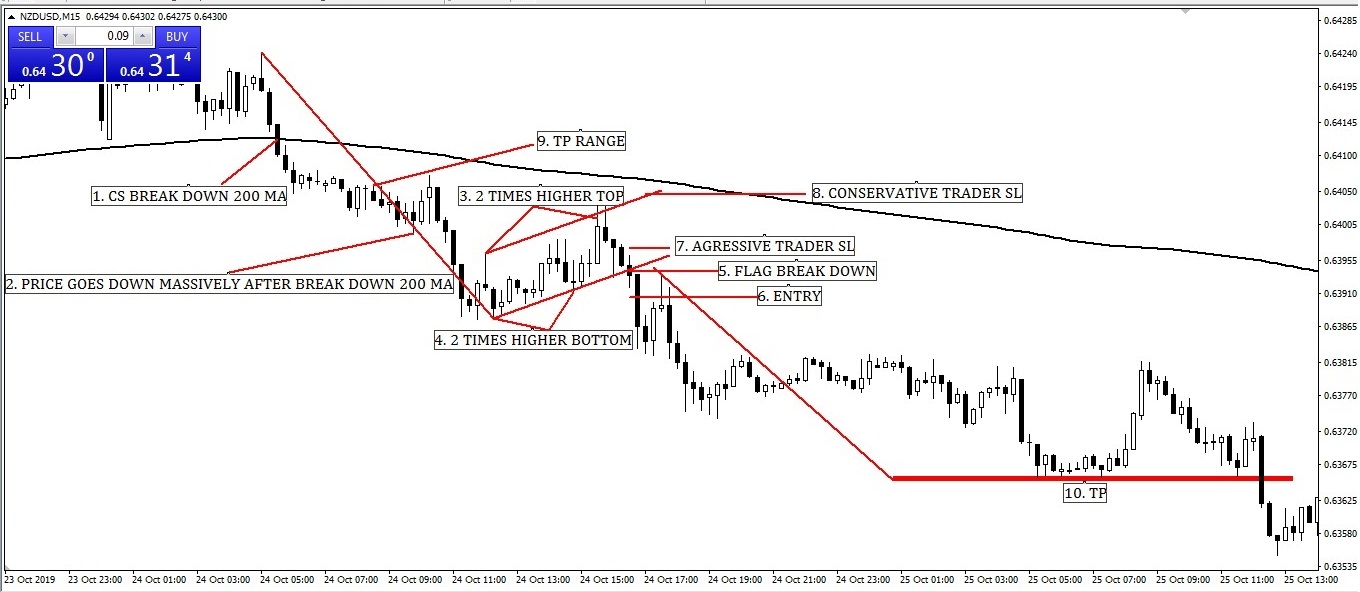
200 Moving Average and Bearish Flag Pattern Entry-Exit Strategy
Image point number – 1, Candlesticks are below 200 Moving Average which means
its downtrend.
Image point number – 2, Already create a few lower low which means the price is
strong uptrend now.
Image point number – 3, Price never up or down straight. As expected price has
gone to correction. Already create three times higher tops but no breakouts
happened.
Image point number – 4, Also the price created two times higher bottom. That chart
indicates its bearish flag pattern. As per rules, we have to wait for the breakout.
Image point number – 5, At last, bearish flag pattern breakouts. As per Bearish Flag
Pattern with 200 Moving Average Entry-Exit Strategy rules its time to sell when
candlesticks close below pattern which indicates a successful breakout.
Image point number – 6, Place SELL STOP order 2 pips below bearish flag pattern
break out candlesticks by the aggressive or conservative trader.
Image point number – 7, Put STOP-LOSS order by aggressive trader 2 pips above
bearish flag pattern breakout candlesticks after hit SELL STOP order.
Image point number – 8, Where STOP LOSS place 2 pips above bearish flag pattern
upper pattern by conservative traders.
Image point number – 9, Lets measure take profit range as per bearish flag pattern
exit rules.
Image point number – 10, Put take profit level on bearish flag pattern take profit
range or near swing high or 1: 2 or 1 : 3 risk-reward ratio by the conservative or
aggressive trader.
Image 19:

200 Moving Average and Bullish Channel Pattern Entry-Exit Strategy
Image point number – 1, Candlesticks are above 200 Moving Average which means
its uptrend.
Image point number – 2, Already create a few higher-high which means the price is
strong uptrend now.
Image point number – 3, Price never up or down straight. As expected price has
gone to correction. Already create two times equal tops but no breakouts happened.
Image point number – 4, Also the price created two times equal bottom. That chart
indicates its bullish channel. As per rules, we have to wait for the breakout.
Image point number – 5, At last, bullish channel breakouts. As per the bullish channel
with 200 Moving Average, Entry-Exit Strategy rules its time to buy when candlesticks
close above channel which indicates a successful breakout.
Image point number – 6, Place BUY STOP order 2 pips above bullish channel break
out candlesticks by the aggressive or conservative trader.
Image point number – 7, Put STOP-LOSS order by aggressive trader 2 pips below
bullish channel breakout candlesticks after hit BUY STOP order.
Image point number – 8, Where STOP LOSS place 2 pips below of bullish channel
lower channel by conservative traders.
Image point number – 9, Lets measure take profit range as per bullish channel exit
rules.
Image point number – 10, Put take profit level on bullish channel take profit range
or near swing high or 1: 2 or 1 : 3 risk-reward ratio by the conservative or aggressive
trader.
Image 20:

200 Moving Average and Bearish Flag Channel Entry-Exit Strategy
Image point number – 1, Candlesticks are below 200 Moving Average which means
its downtrend.
Image point number – 2, Already create a few lower low which means the price is
strong downtrend now.
Image point number – 3, Price never up or down straight. As expected price has
gone to correction. Already create two times equal tops but no breakouts happened.
Image point number – 4, Also the price created two times equal bottom. That chart
indicates its bearish channel. As per rules, we have to wait for the breakout.
Image point number – 5, At last, bearish channel breakouts. As per Bearish channel
with 200 Moving Average, Entry-Exit Strategy rules its time to sell when candlesticks
close below channel which indicates a successful breakout.
Image point number – 6, Place SELL STOP order 2 pips below bearish channel break
out candlesticks by the aggressive or conservative trader.
Image point number – 7, Put STOP-LOSS order by aggressive trader 2 pips above
bearish channel breakout candlesticks after hit SELL STOP order.
Image point number – 8, Where STOP LOSS place 2 pips above the bearish channel
upper channel by conservative traders.
Image point number – 9, Lets measure take profit range as per bearish channel exit
rules.
Image point number – 10, Put take profit level on bearish channel take profit range
or near swing high or 1: 2 or 1 : 3 risk-reward ratio by the conservative or aggressive
trader.
200 Moving Average Strategy. (Part- 6)
Here we have discussed how entry and exit 200 Moving Average Golden Cross and
Death Cross. The below link is for your detailed understanding.
200 Moving Average Strategy. (Part- 6) Click here
Summery is below here……
Image 21:
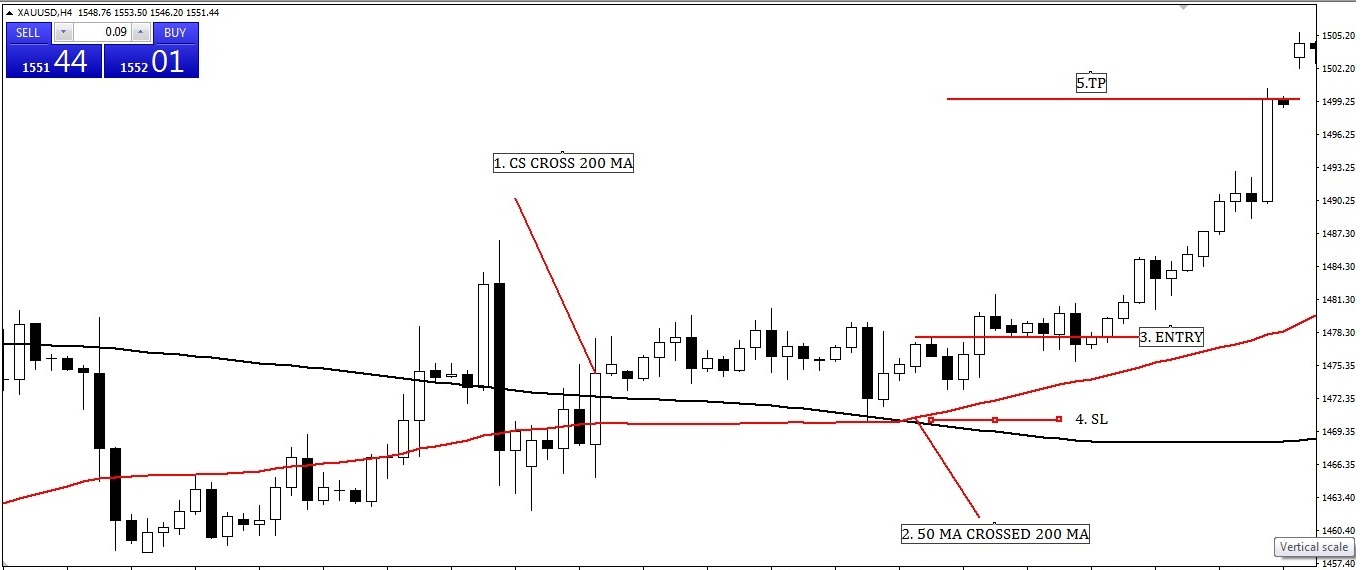
Aggressive Golden Cross Entry-Exit Strategy.
Image point number – 1, Candlesticks are above 200 Moving Average which means
its uptrend.
Image point number – 2, Candlesticks never close below 200 Simple Moving
Average though we observe sideways movement above 200 Simple Moving Average.
Identified till now bullish trend lets wait for Golden Cross.
After Golden Cross created hope price will go up massively.
Image point number – 3, Place BUY STOP order 2 pips above Golden Crossing
candlesticks by the aggressive or conservative trader.
Image point number – 4, Put STOP-LOSS order by aggressive trader 2 pips below 50
Simple Moving Average after hit BUY STOP order.
Where STOP LOSS place 2 pips below 200 Simple Moving Average by conservative
traders.
Image point number – 5, Put take profit level on the near swing high or 1 : 2 or 1 : 3
the risk-reward ratio by the conservative or aggressive trader.
Image 22:
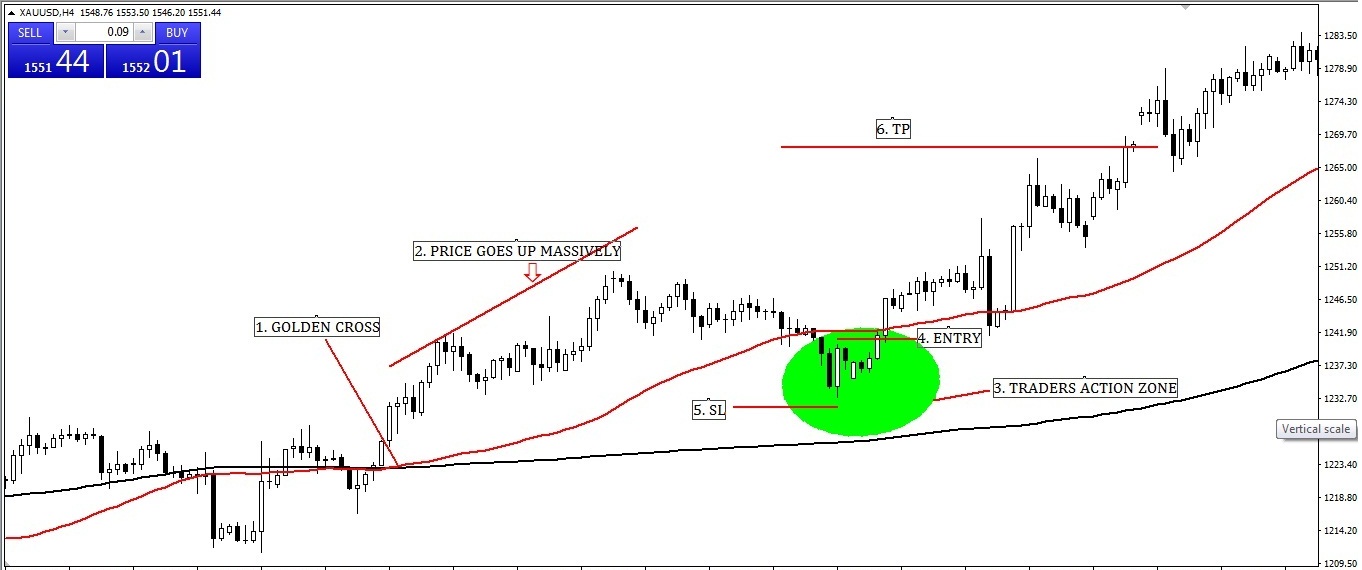
Golden Cross Traders Action Zone (TAZ) Entry-Exit Strategy.
Image point number – 1, Candlesticks are above 200 Moving Average which means
its uptrend.
Image point number – 2, Though price goes up massively after the Golden Cross, but
don’t be greedy because we have to wait until the price comes back Traders Action Zone
(TAZ). As a disciplined trader, we must follow Traders Action Zone (TAZ) Entry and
Exit Strategy rules.
Image point number – 3, After come back in Traders Action Zone (TAZ), Now time to
identify bullish price action reversal candlesticks pattern (PIN BAR, BULLISH
ENGULFING, MORNING STAR, HAMMER, HARAMI, PIERCING, DOJI, etc.)
Image point number – 4, Place BUY STOP order 2 pips above Bullish price action
reversal candlesticks in Traders Action Zone (TAZ) area by the aggressive or
conservative trader.
Image point number – 5, Put STOP-LOSS order by aggressive trader 2 pips below
price action reversal candlesticks after hit BUY STOP order.
Where STOP LOSS place 2 pips below 200 Simple Moving Average by conservative
traders.
Image point number – 6, Put take profit level on the near swing high or 1: 2 or 1 : 3
the risk-reward ratio by the conservative or aggressive trader.
Image 23:
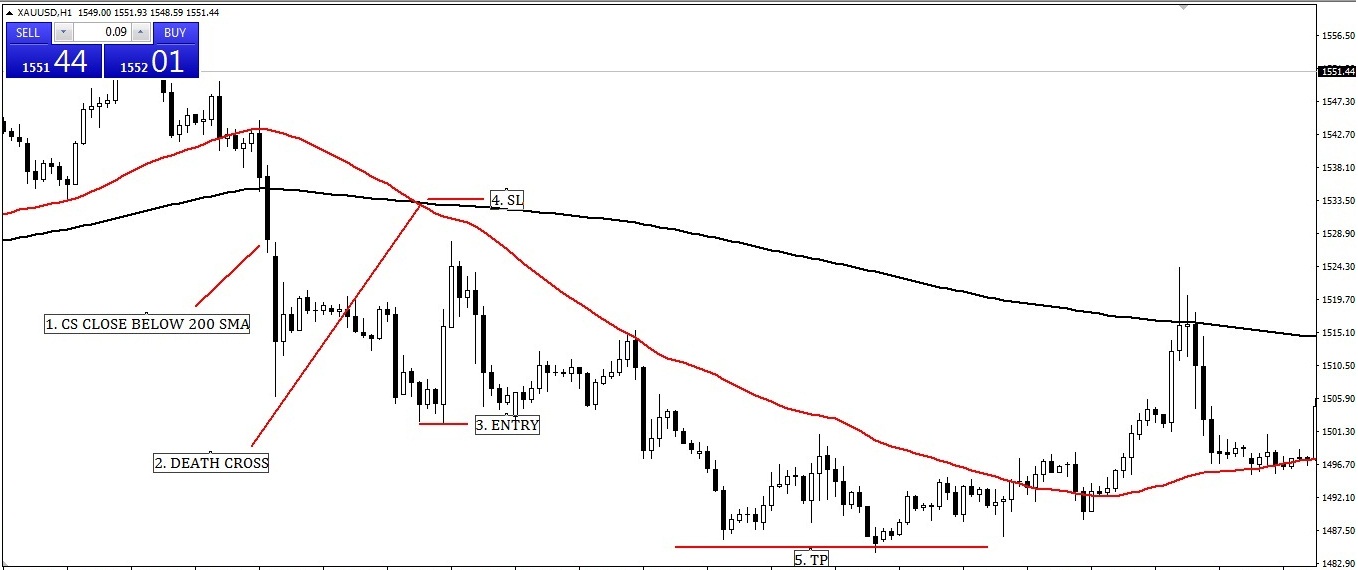
Aggressive Death Cross Entry-Exit Strategy.
Image point number – 1, Candlesticks are below 200 Moving Average which means
its downtrend.
Image point number – 2, Candlesticks never close above 200 Simple Moving Average
though we observe sideways movement above 200 Simple Moving Average. Identified
till now downtrend lets wait for Death Cross.
After Death Cross created hope price will go down massively.
Image point number – 3, Place SELL STOP order 2 pips below Death Crossing
candlesticks by the aggressive or conservative trader.
Image point number – 4, Put STOP-LOSS order by aggressive trader 2 pips above 50
Simple Moving Average after hit the SELL STOP order.
Where STOP LOSS place 2 pips above 200 Simple Moving Average by conservative
traders.
Image point number – 5, Put take profit level on the near swing low or 1: 2 or 1 : 3
the risk-reward ratio by the conservative or aggressive trader.
Image 24:
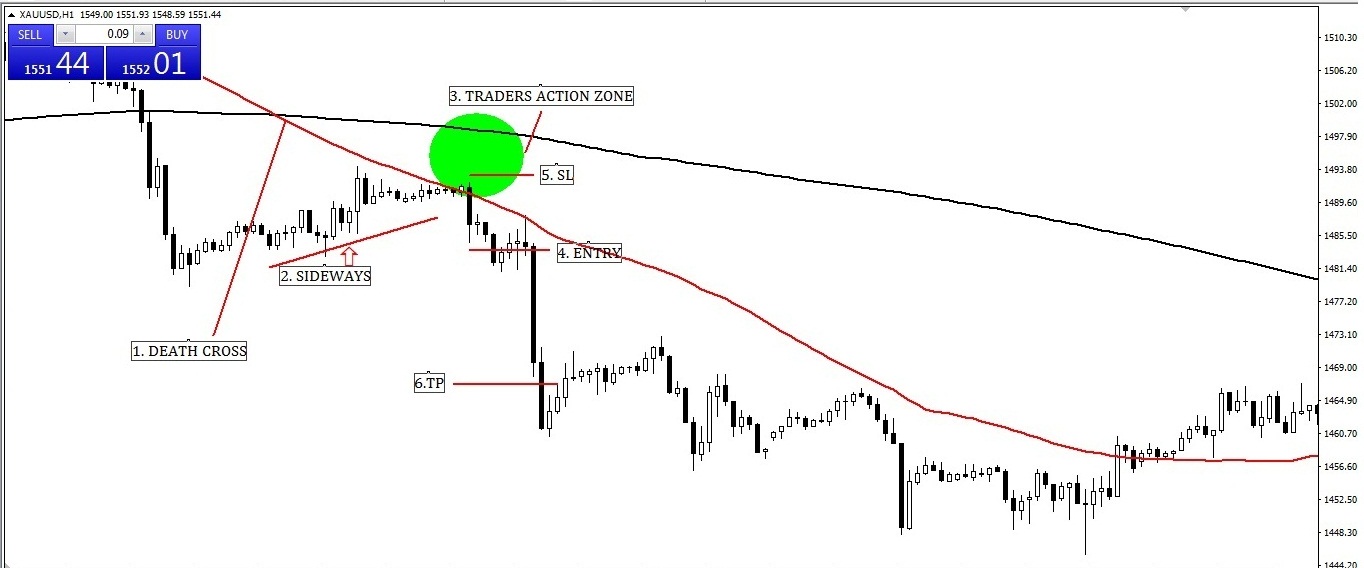
Death Cross Traders Action Zone (TAZ) Entry-Exit Strategy.
Image point number – 1, Candlesticks are below 200 Moving Average which means
its uptrend.
Image point number – 2, Though price goes down massively after the Death Cross,
but don’t be greedy because we have to wait until the price comes back Traders Action
Zone (TAZ). As a disciplined trader, we must follow the Traders Action Zone (TAZ) Entry
and Exit Strategy rules.
Image point number – 3, After come back in Traders Action Zone (TAZ), Now time to
identify bearish price action reversal candlesticks pattern (PIN BAR, BEARISH
ENGULFING, SHOOTING STAR, HARAMI, DARK CLOUD COVER, DOJI, etc.)
Image point number – 4, Place SELL STOP order 2 pips below Bearish price action
reversal candlesticks in Traders Action Zone (TAZ) area by the aggressive or
conservative trader.
Image point number – 5, Put STOP-LOSS order by aggressive trader 2 pips above
price action reversal candlesticks after hit SELL STOP order.
Where STOP LOSS place 2 pips above 200 Simple Moving Average by conservative
traders.
Image point number – 6, Put take profit level on the near swing low or 1 : 2 or 1 : 3
the risk-reward ratio by the conservative or aggressive trader.
200 Moving Average Strategy. (Part- 7)
Here we have discussed how entry and exit 200 Moving Average Double Golden Cross
and Double Death Cross. The below link is for your detailed understanding.
200 Moving Average Strategy. (Part- 7) Click here
Summery is below here……
Image 25:
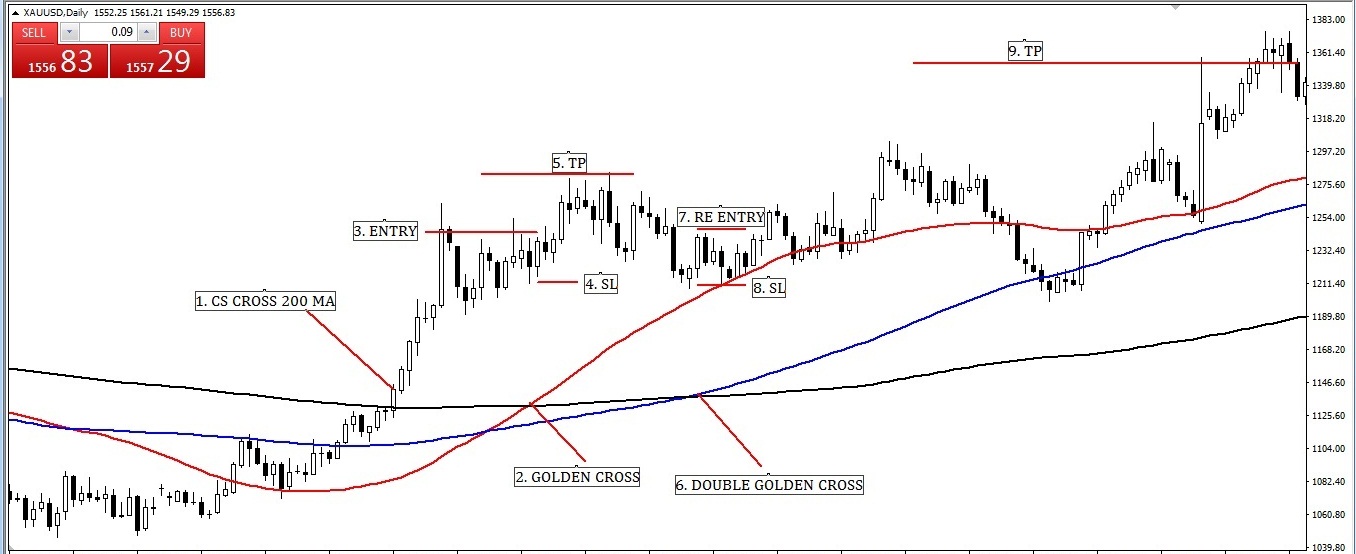
Aggressive Double Golden Cross Entry-Exit Strategy.
Image point number – 1, Candlesticks are above 200 Moving Average which means
its uptrend.
Image point number – 2, Candlesticks never close below 200 Simple Moving
Average though we observe sideways movement above 200 Simple Moving Average.
Identified till now bullish trend lets wait for Golden Cross.
After Golden Cross created hope price will go up massively.
Image point number – 3, Place BUY STOP order 2 pips above Golden Crossing
candlesticks by the aggressive or conservative trader.
Image point number – 4, Put STOP-LOSS order by aggressive trader 2 pips below 50
Simple Moving Average after hit BUY STOP order.
Where STOP LOSS place 2 pips below 200 Simple Moving Average by conservative
traders.
Image point number – 5, Put take profit level on the near swing high or 1: 2 or 1 : 3
the risk-reward ratio by the conservative or aggressive trader.
Image point number – 6, After hitting the previous setup take profit, Candlesticks never
close below 200 Simple Moving Average though we observe sideways movement
above 200 Simple Moving Average. Identified till now bullish trend lets wait for
Double Golden Cross.
After Golden Cross created hope price will go up massively.
Image point number – 7, Place BUY STOP order 2 pips above Double Golden
Crossing candlesticks by the aggressive or conservative trader.
Image point number – 8, Put STOP-LOSS order by aggressive trader 2 pips below of
entry candlesticks.
Where STOP LOSS place 2 pips below 50 Simple Moving Average or 100 Simple
Moving Average or 200 Simple Moving Average by conservative traders.
Image point number – 9, Put take profit level on the near swing high or 1: 2 or 1 : 3
the risk-reward ratio by the conservative or aggressive trader.
Image 26:
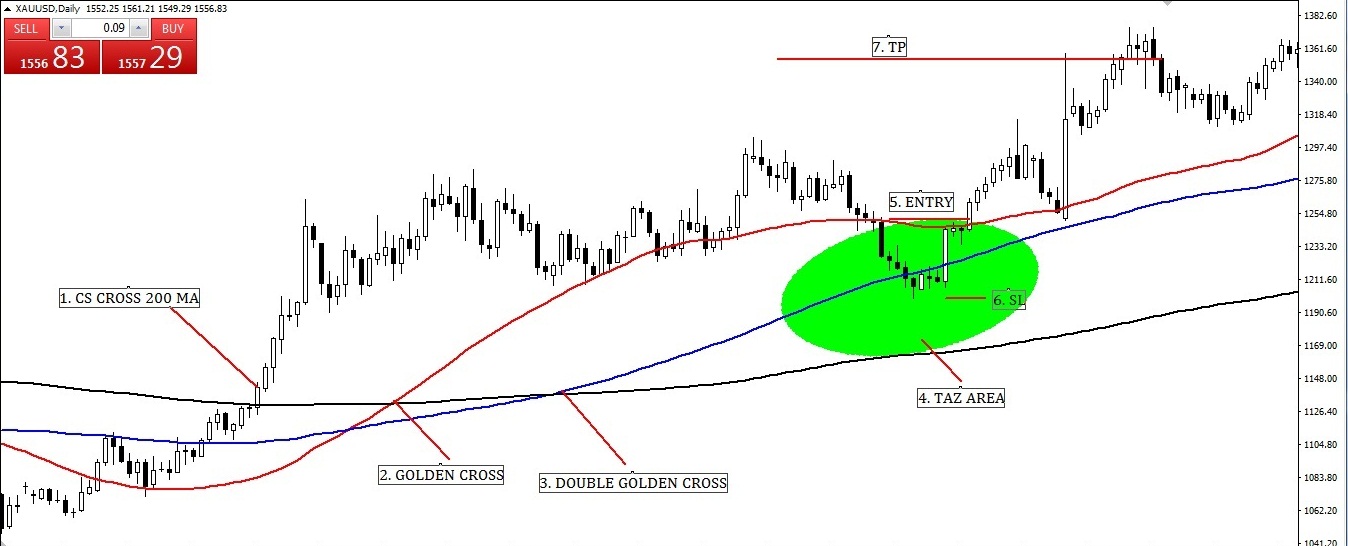
Double Golden Cross Traders Action Zone (TAZ) Entry-Exit Strategy.
Image point number – 1, Candlesticks are above 200 Moving Average which means
its uptrend.
Image point number – 2, Though price goes up massively after the Golden Cross, but
don’t be greedy because we have to wait until the price comes back Traders Action Zone
(TAZ). As a disciplined trader, we must follow Traders Action Zone (TAZ) Entry and
Exit Strategy rules.
Image point number – 3, Though price goes up massively after the Double Golden
Cross, but don’t be greedy because we have to wait until the price comes back Traders
Action Zone (TAZ). As a disciplined trader, we must follow Traders Action Zone (TAZ)
Entry and Exit Strategy rules.
Image point number – 4, After come back in Traders Action Zone (TAZ), Now time to
identify bullish price action reversal candlesticks pattern (PIN BAR, BULLISH
ENGULFING, MORNING STAR, HAMMER, HARAMI, PIERCING, DOJI, etc.)
Image point number – 5, Place BUY STOP order 2 pips above Bullish price action
reversal candlesticks in Traders Action Zone (TAZ) area by the aggressive or
conservative trader.
Image point number – 6, Put STOP-LOSS order by aggressive trader 2 pips below
price action reversal candlesticks after hit BUY STOP order.
Where STOP LOSS place 2 pips below 200 Simple Moving Average by conservative
traders.
Image point number – 7, Put take profit level on the near swing high or 1: 2 or 1 : 3
the risk-reward ratio by the conservative or aggressive trader.
Image 27:
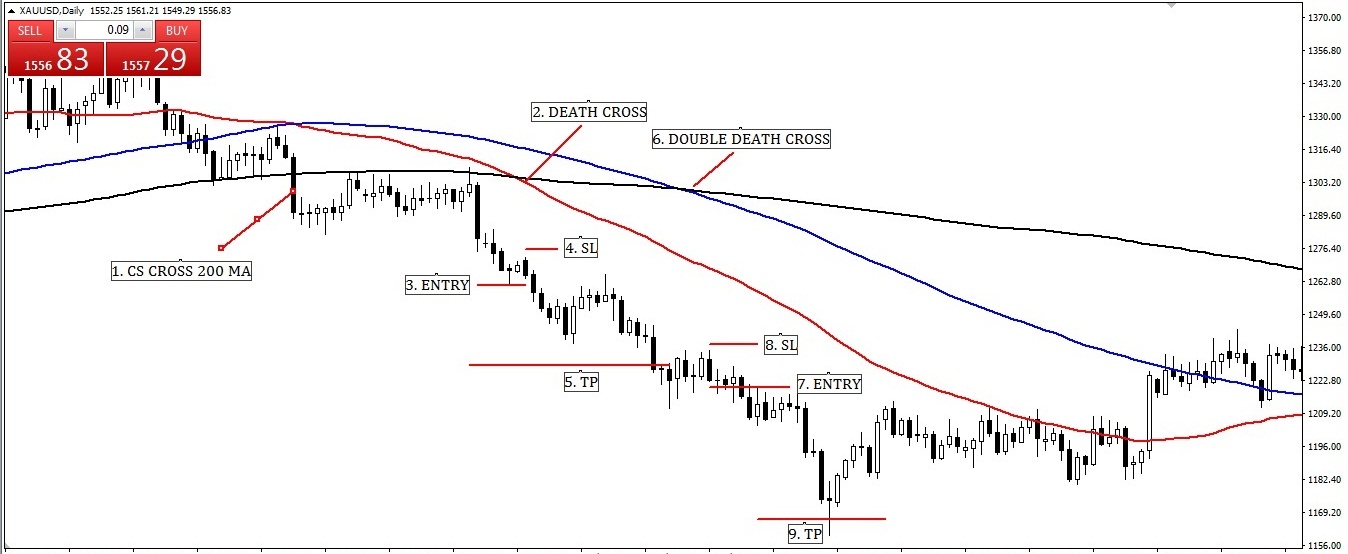
Aggressive Double Death Cross Entry-Exit Strategy.
Image point number – 1, Candlesticks are below 200 Moving Average which means
its downtrend.
Image point number – 2, Candlesticks never close above 200 Simple Moving Average
though we observe sideways movement above 200 Simple Moving Average. Identified
till now bearish trend lets wait for Death Cross.
After Death Cross created hope price will go down massively.
Image point number – 3, Place SELL STOP order 2 pips above Death Crossing
candlesticks by the aggressive or conservative trader.
Image point number – 4, Put STOP-LOSS order by aggressive trader 2 pips above 50
Simple Moving Average after hit the SELL STOP order.
Where STOP LOSS place 2 pips above 200 Simple Moving Average by conservative
traders.
Image point number – 5, Put take profit level on the near swing low or 1: 2 or 1 : 3
the risk-reward ratio by the conservative or aggressive trader.
Image point number – 6, After hitting the previous setup take profit, Candlesticks never
close above 200 Simple Moving Average though we observe sideways movement
above 200 Simple Moving Average. Identified till now bearish trend lets wait for
Double Death Cross.
After Death Death Cross created hope price will go down massively.
Image point number – 7, Place SELL STOP order 2 pips below Double Death Crossing
candlesticks by the aggressive or conservative trader.
Image point number – 8, Put STOP-LOSS order by aggressive trader 2 pips above of
entry candlesticks.
Where STOP LOSS place 2 pips above 50 Simple Moving Average or 100 Simple
Moving Average or 200 Simple Moving Average by conservative traders.
Image point number – 9, Put take profit level on the near swing low or 1 : 2 or 1 : 3
the risk-reward ratio by the conservative or aggressive trader.
Image 28:

Double Death Cross Traders Action Zone (TAZ) Entry-Exit Strategy.
Image point number – 1, Candlesticks are above 200 Moving Average which means
its downtrend.
Image point number – 2, Though price goes down massively after the Death Cross,
but don’t be greedy because we have to wait until the price comes back Traders Action
Zone (TAZ). As a disciplined trader, we must follow the Traders Action Zone (TAZ) Entry
and Exit Strategy rules.
Image point number – 3, Also Though price goes up massively after the Double
Death Cross, but don’t be greedy because we have to wait until the price comes back
Traders Action Zone (TAZ). As a disciplined trader, we must follow Traders Action
Zone (TAZ) Entry and Exit Strategy rules.
Image point number – 4, After come back in Traders Action Zone (TAZ), Now time to
identify bearish price action reversal candlesticks pattern (PIN BAR, BEARISH
ENGULFING, SHOOTING STAR, HARAMI, K CLOUD COVER, DOJI, etc.)
Image point number – 5, Place SELL STOP order 2 pips above Bearish price action
reversal candlesticks in Traders Action Zone (TAZ) area by the aggressive or
conservative trader.
Image point number – 6, Put STOP-LOSS order by aggressive trader 2 pips above
price action reversal candlesticks after hit the SELL STOP order.
Where STOP LOSS place 2 pips above 200 Simple Moving Average by conservative
traders.
Image point number – 7, Put take profit level on the near swing low or 1 : 2 or 1 : 3
the risk-reward ratio by the conservative or aggressive trader.
200 Moving Average Strategy. (Part- 8)
Here we have discussed how entry and exit 200 Moving Average with the multi time
frame. The below link is for your detailed understanding.
Summery is below here……
200 Moving Average Strategy. (Part- 8) Click here
IMAGE 29:
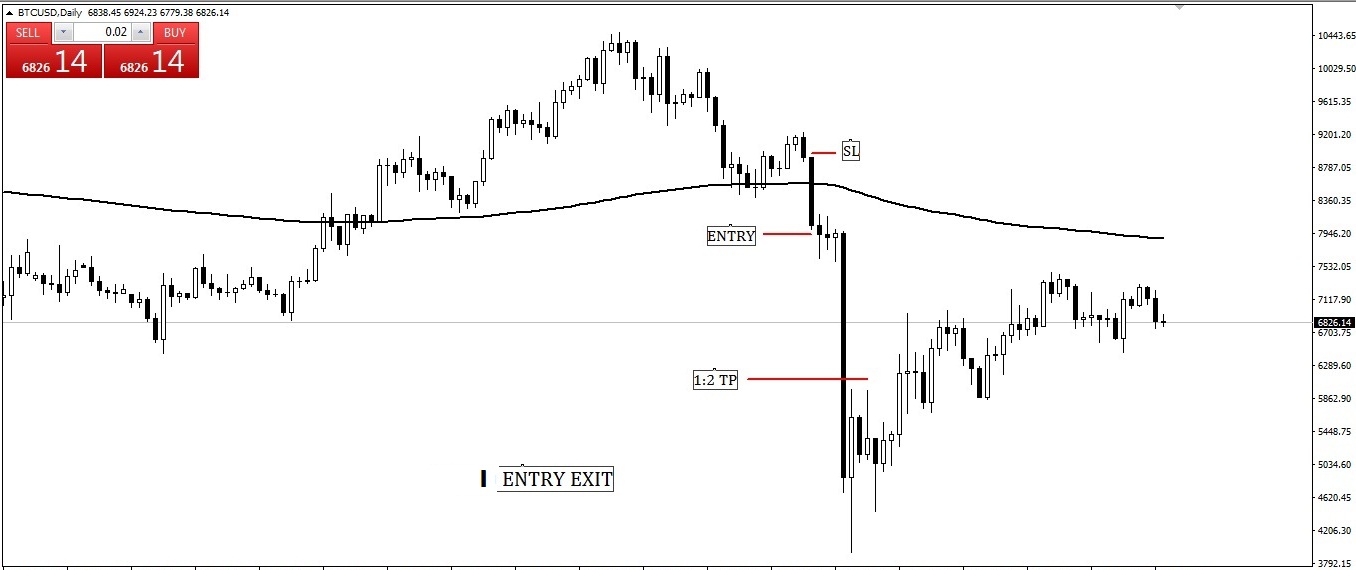
X ENTRY
After daily Bearish Engulfing candlesticks close below 200 Moving Average of
BITCOIN, X enter here below 5 pips. Stop Loss set 5 pips above of Bearish
Engulfing candlesticks. Also, take profit level ser 1:2 or Swing Low. Here swing low
measured 1:1.7 thereafter X determined to set take profit level at 1:2.
WAOOOOO……Take profit hit.
X feeling excellent that his trade hit 1:2
IMAGE 30:
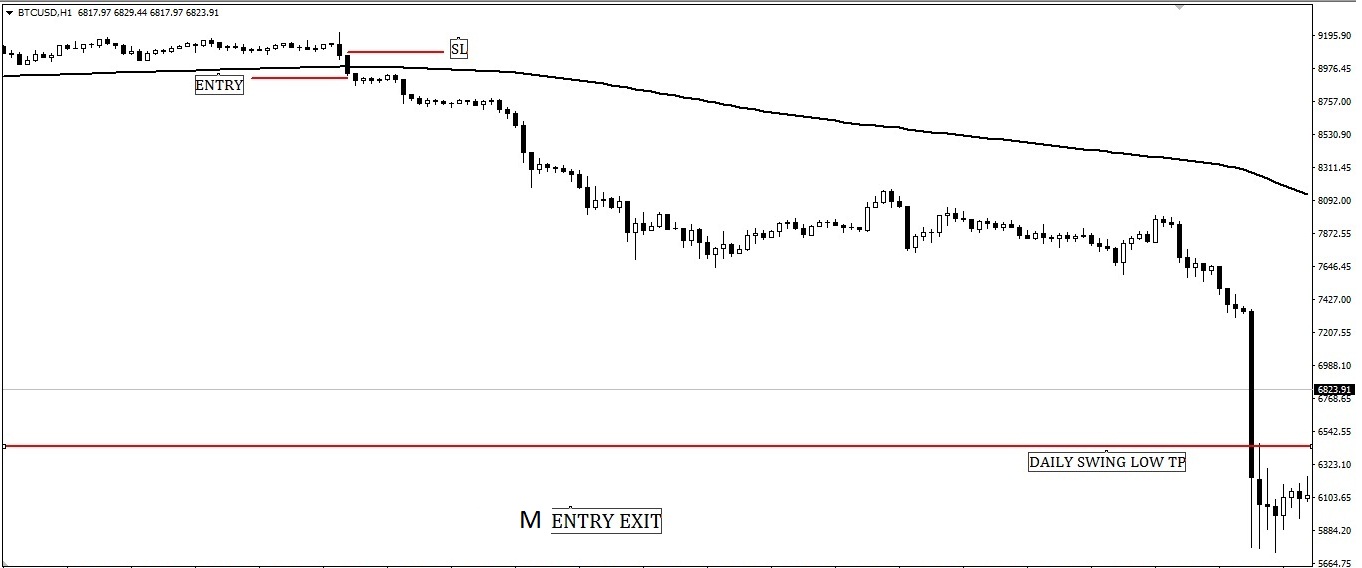
Y ENTRY
After hourly Bearish Engulfing candlesticks close below 200 Moving Average of
BITCOIN, Y enter here below 5 pips. Stop Loss set 5 pips above of Bearish
Engulfing candlesticks.
Before entry hourly Bearish Engulfing candlesticks Y watched Daily chart and
understand that BITCOIN will cross daily 200 Moving Average immediately. At a time
Y switched to hourly chart and keep focus till candlesticks cross 200 hourly
Moving Average. Here daily swing low is 1:17 and Y set take profit level on
the swing low. WAOOOOO……Take profit hit.
Y feeling excellent that his trade hit 1:17
Its the power of MULTI TIME FRAME analysis……… were applied for same entry and
exit strategy Y earns more than 15 times of X
Below simple technique for you when using multi-timeframe analysis…..
When you are day trader, First Identify trend on H1 then entry on M15.
When If you are swing trader, First Identify trend on D1 then entry on H1.
When If you are position trader, First Identify trend on W1 then entry on D1.
D1 mean Daily Candlesticks, H1 means One Hour Candlesticks, M15 means 15 Minute
candlesticks and W1 means weekly candlesticks.
200 Moving Average with Multi time frame Entry-Exit Strategy:
When you trade Multi time frame 200 Moving Average Buy Entry-Exit Strategy
(as a Swing Trader) you must have followed below rules:
Rules 1: Observe Candlesticks’ position. When candlesticks cross daily 200 Moving
Average from below at a time switched one hour chart.
Rules 2: Observe one-hour candlesticks pattern and try to find out is it cross 200
Moving Average. Try to identify candlesticks pattern if it crosses 200 Moving Average.
The best candlesticks pattern is Engulfing, Doji and Inside bar when 200 Moving
Average crossing or retest.
Rules 3: Put Buy Stop two to five pips above of identified candlesticks. Also, put stop
loss two to five pips below of identified candlesticks. And put profit level on the daily
swing high or 1:2, 1:3 risk-reward ratio on the daily time frame.
When you trade Multi time frame 200 Moving Average Sell Entry-Exit Strategy
(as a Swing Trader) you must have followed below rules:
Rules 1: Observe Candlesticks’ position. When candlesticks cross daily 200 Moving
Average from above at a time switched one hour chart.
Rules 2: Observe one-hour candlesticks pattern and try to find out is it crosses 200
Moving Average. Try to identify candlesticks pattern if it crosses 200 Moving Average.
The best candlesticks pattern is Engulfing, Doji and Inside bar when 200 Moving
Average crossing or retest.
Rules 3: Put Sell Stop two to five pips below of identified candlesticks. Also, put stop
loss two to five pips above of identified candlesticks. And put profit level on the daily
swing low or 1:2, 1:3 risk-reward ratio on the daily time frame.
When you trade Multi time frame 200 Moving Average Buy Entry-Exit Strategy
(as a day Trader) you must have followed below rules:
Rules 1: Observe Candlesticks’ position. When candlesticks cross hourly 200 Moving
Average from below at a time switched Fifteen Minute chart.
Rules 2: Observe Fifteen Minute candlesticks pattern and try to find out is it cross 200
Moving Average. Try to identify candlesticks pattern if it cross 200 Moving Average.
The best candlesticks pattern is Engulfing, Doji and Inside bar when 200 Moving
Average crossing or retest.
Rules 3: Put Buy Stop two to five pips above of identified candlesticks. Also, put stop
loss two to five pips below of identified candlesticks. And put profit level on the daily
swing high or 1:2, 1:3 risk-reward ratio on the daily time frame.
When you trade Multi time frame 200 Moving Average Sell Entry-Exit Strategy
(as a Day Trader) you must have followed below rules:
Rules 1: Observe Candlesticks’ position. When candlesticks cross hourly 200 Moving
Average from above at a time switched Fifteen Minute chart.
Rules 2: Observe Fifteen Minute candlesticks pattern and try to find out is it crosses
200 Moving Average. Try to identify candlesticks pattern if it crosses 200 Moving
Average. The best candlesticks pattern is Engulfing, Doji and Inside bar when 200
Moving Average crossing or retest.
Rules 3: Put Sell Stop two to five pips below of identified candlesticks. Also, put stop
loss two to five pips above of identified candlesticks. And put profit level on the daily
swing low or 1:2, 1:3 risk-reward ratio on the daily time frame.
When you trade Multi time frame 200 Moving Average Buy Entry-Exit Strategy
(as a Position Trader) you must have followed below rules:
Rules 1: Observe Candlesticks’ position. When candlesticks cross Weekly 200 Moving
Average from below at a time switched Daily chart.
Rules 2: Observe Daily candlesticks pattern and try to find out is it cross 200 Moving
Average. Try to identify candlesticks pattern if it crosses 200 Moving Average. The best
candlesticks pattern is Engulfing, Doji, and Inside bar when 200 Moving Average
crossing or retest.
Rules 3: Put Buy Stop two to five pips above of identified candlesticks. Also, put stop
loss two to five pips below of identified candlesticks. And put profit level on the daily
swing high or 1:2, 1:3 risk-reward ratio on the daily time frame.
When you trade Multi time frame 200 Moving Average Sell Entry-Exit Strategy
(as a Position Trader) you must have followed below rules:
Rules 1: Observe Candlesticks’ position. When candlesticks cross Weekly 200 Moving
Average from above at a time switched Daily chart.
Rules 2: Observe Dailycandlesticks pattern and try to find out is it crosses 200 Moving
Average. Try to identify candlesticks pattern if it crosses 200 Moving Average. The best
candlesticks pattern is Engulfing, Doji, and Inside bar when 200 Moving Average
crossing or retest.
Rules 3: Put Sell Stop two to five pips below of identified candlesticks. Also, put stop
loss two to five pips above of identified candlesticks. And put profit level on the daily
swing low or 1:2, 1:3 risk-reward ratio on the daily time frame.
WAOO….. IT’S NEAR SEVEN THOUSAND CONTENT ARTICLE. SO IT WILL
TAKE YOUR VALUABLE TIME. KEEP PATIENCE. REMEMBER, TODAY HARD
WORKING WILL CREATE YOU A CONSISTENTLY PROFITABLE FOREX,
STOCK, COMMODITY, AND OPTION TRADER. THERE IS NO SHORTCUT
HERE. IF YOU TRY TO KNOW ABOUT SUCCESSFUL FOREX, STOCK,
COMMODITY AND OPTION TRADER IN THE WORLD, YOU MUST FIND ONE
SIMILARITY OF ALL. THIS SIMILARITY IS HARD WORKING AND DESIRE TO
BE SUCCESSFUL.
Special suggestion from the earnmoneyfx.com team…….
If you are a beginner trader, try to adopt one or two strategies from here.
If you are advanced trader, try to adopt one by one strategy from here.
If you are an expert trader, try to adopt all strategies from here.
Thanks for giving your most valuable time and keep touch earnmoneyfx.com also
leave your valuable comment.
Earnmoneyfx.com team will present here new series articles for you.
~~~~~~~~~~~~~~~~~~~~ THANKS ~~~~~~~~~~~~~~~~~~~~~


