 Earn Money Forex Best Forex Trading Experience


Bollinger Band All Strategies At a Glance
Dear Friends…….Thanks a lot for visit earnmoneyfx.com. It was our excellent journey published the Bollinger Band Strategy series one by one. It was the ten-part series. Now earnmoneyfx.com research team present herewith summary of all Strategies. Its name is Bollinger Band All Strategies At a Glance.
earnmoneyfx.com research team always believes, anybody will be consistently profitable forex, stock, commodity, the crypto trader. When he/she follows properly all of the rules of this series.
It will be easy to understand and apply If you will get all series strategy at a time. Thus as like as 200 Moving Average all strategies at a glance, earnmoneyfx.com research team presents here the summary of all Strategies.
Let’s Start….
What is the Bollinger Band:
John Bollinger was developed by Bollinger Band. Its registered trademark is Bollinger Band® and patent also by name John Bollinger.
Bollinger Band is very simple. It has three bands e.g. Upper Band, Middle Band, and Lower Band.
Upper Band and Lower Band are volatility-based Bands which volatility is based on standard deviation. Increase and decrease of volatility identified by standard deviation indicator. Standard deviation 2 is the standard parameter for an upper Band and lower Band.
When volatility increases the band widens. Also when volatility decreases the band contract.
20 Simple Moving Average is Middle Band. The main logic of use 20 Simple Moving Average as Bollinger Middle Band here is that Simple Moving Average is one of the most elements to create standard deviation formula.
Calculation of Bollinger Band:
* Middle Band = 20-day simple moving average (SMA)
* Upper Band = 20-day SMA + (20-day standard deviation of price x 2)
* Lower Band = 20-day SMA – (20-day standard deviation of price x 2)
As per John Bollinger suggestion,
You must set standard deviation multiplier 2 when the simple moving average is 20. Also, the standard deviation value is 20.
You must set standard deviation multiplier 2.1 when the simple moving average is 50. Also, the standard deviation value is 50.
You must set a standard deviation multiplier 1.9 when the simple moving average is 10. Also, the standard deviation value is 10.
Bollinger Band Strategies (Part-1):
Here we have discussed the Candlesticks Pattern with Bollinger Band Entry-Exit Strategy. Also Double Top Chart Pattern with Bollinger Band Entry-Exit Strategy.
The below link is for your ready reference for details.
Bollinger Band Strategies (Part-1)
Below summaries are for your easy understanding……

Image: Candlesticks Pattern with Bollinger Band Entry-Exit Strategy.
Image point number – 1, Price goes down continuously.
Image point number- 2, After create 3rd lower low, A pin bar candlesticks create in Bollinger Lower Band. That means the current downtrend will be paused. But we don’t buy it here. We must observe the market.
Image point number – 3, Price look likes want to complete downtrend. Candlesticks close above Bollinger Middle Band but wait. It’s not our buy time. We need more confirmation.
Image point number – 4, It’s a time of fighting BULL and BEAR. Till now price is sideways now. We have to wait and observe and try to find out who will win…… BULL or BEAR.
Image point number – 5, After fighting with bull and bear …….. Bulls are win where the trend line already breakout.
Image point number – 6, Conservative trader put their BUY STOP order two to five pips above of the trend line breakout candlesticks.
Image point number – 7, After hitting BUY STOP order, We place STOP LOSS two to five pips below of trend line breakout candlesticks.
Image point number – 8, Aggressive trader place their buy stop order after breakout Bollinger Upper Band.
Image point number – 9, Near Swing High or 1: 2 or 1 : 3 risk-reward ratio, Conservative or aggressive trader place TP.
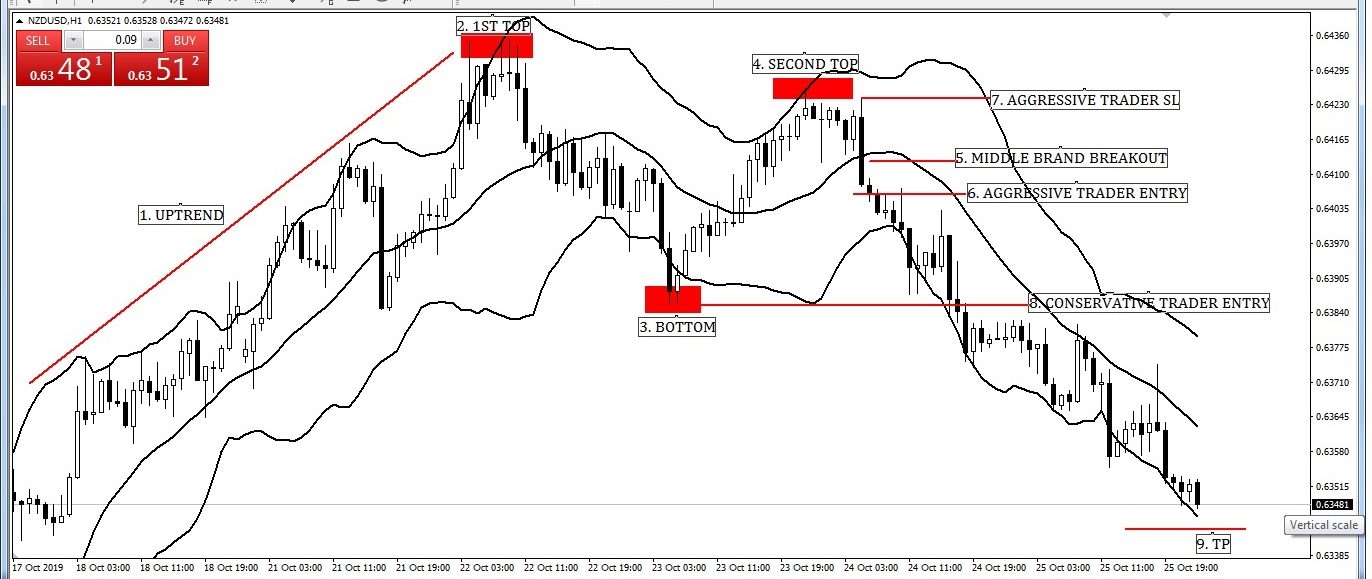
Image: Double Top Chart Pattern with Bollinger Band Entry-Exit Strategy
Image point number – 1, Price goes up strongly with Bollinger Upper Band and Higher High.
Image point number – 2, After the first top created, Few candlesticks try to break first top but failure. Thereafter price cross below Bollinger Middle Band. Thus we are sure that it is first top.
Image point number – 3, After that a bottom has created. Which also cross Bollinger Lower Band but failure to break the previous low.
Image point number – 4, Its time to waiting for another top (First top higher of lower whatever no matter). At last second top created.
Image point number – 5, After close below Bollinger Middle Band which confirms that it’s second top.
Image point number – 6, Aggressive trader put their SELL STOP order two to five pips below of the Bollinger Middle Band breakout candlesticks.
Image point number – 7, After hitting SELL STOP order, Aggressive trader place STOP LOSS two to five pips above of Bollinger Middle Band breakout candlesticks.
Image point number – 8, Conservative trader put their SELL STOP order two to five pips below of the bottom candlesticks for breakdown confirmation.
Image point number – 9, Near Swing low or 1: 2 or 1 : 3 risk-reward ratio, Conservative or aggressive trader place TP.
Bollinger Band Strategies (Part-2):
Here we have discussed the Double Bottom Chart Pattern with Bollinger Band Entry-Exit Strategy. Also Reversal Candlesticks with Bollinger Band Entry-Exit Strategy.
The below link is for your ready reference for details.
Bollinger Band Strategies (Part-2)
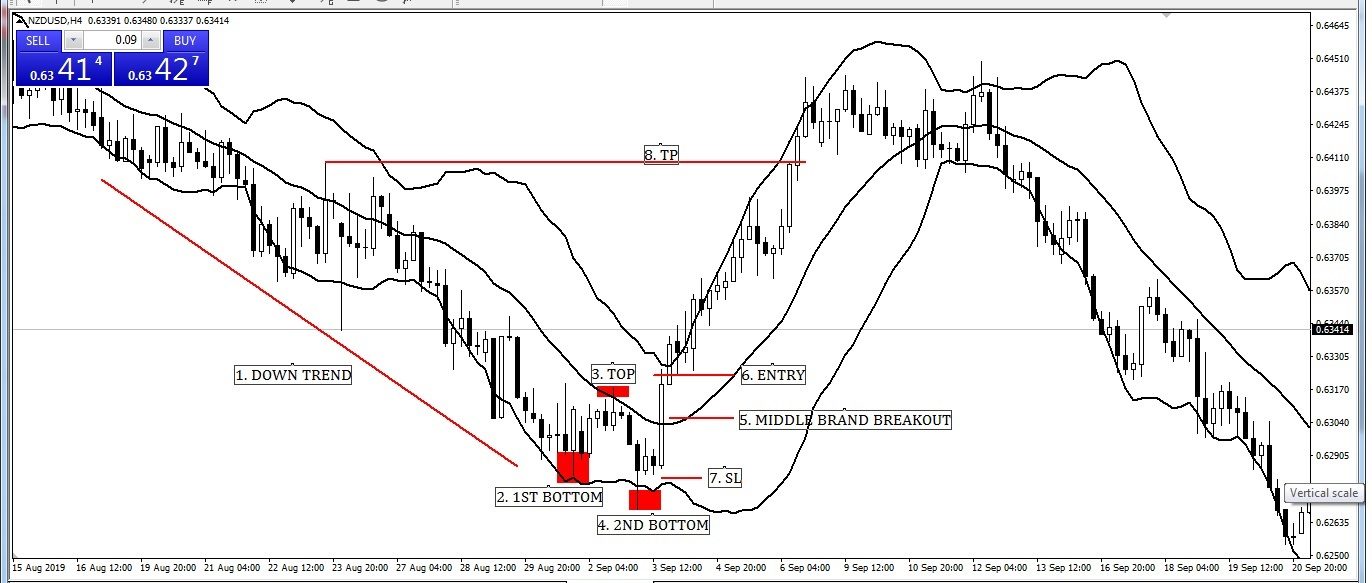
Image: Double Bottom Chart Pattern with Bollinger Band Entry-Exit Strategy
Image point number – 1, Price goes down strongly with Bollinger Lower Band and create Lower Low.
Image point number – 2, After the first bottom created, Few candlesticks try to break first bottom but failure. After price cross above Bollinger Middle Band thereafter we are sure that its first bottom.
Image point number – 3, After that a top has created. Which also cross Bollinger Middle Band but failure to break previous High.
Image point number – 4, Its time to waiting for another bottom (First top higher of lower whatever no matter). At last, second-bottom created.
Image point number – 5, After close above Bollinger Middle Band which confirms that it’s the second bottom.
Image point number – 6, Aggressive or conservative trader put their BUY STOP order two to five pips above of the Bollinger Middle Band breakout candlesticks.
Image point number – 7, After hitting BUY STOP order, Aggressive or conservative trader place STOP LOSS two to five pips below of Bollinger Middle Band breakout candlesticks.
Image point number – 8, Near Swing High or 1: 2 or 1 : 3 risk-reward ratio, Conservative or aggressive trader place TP.
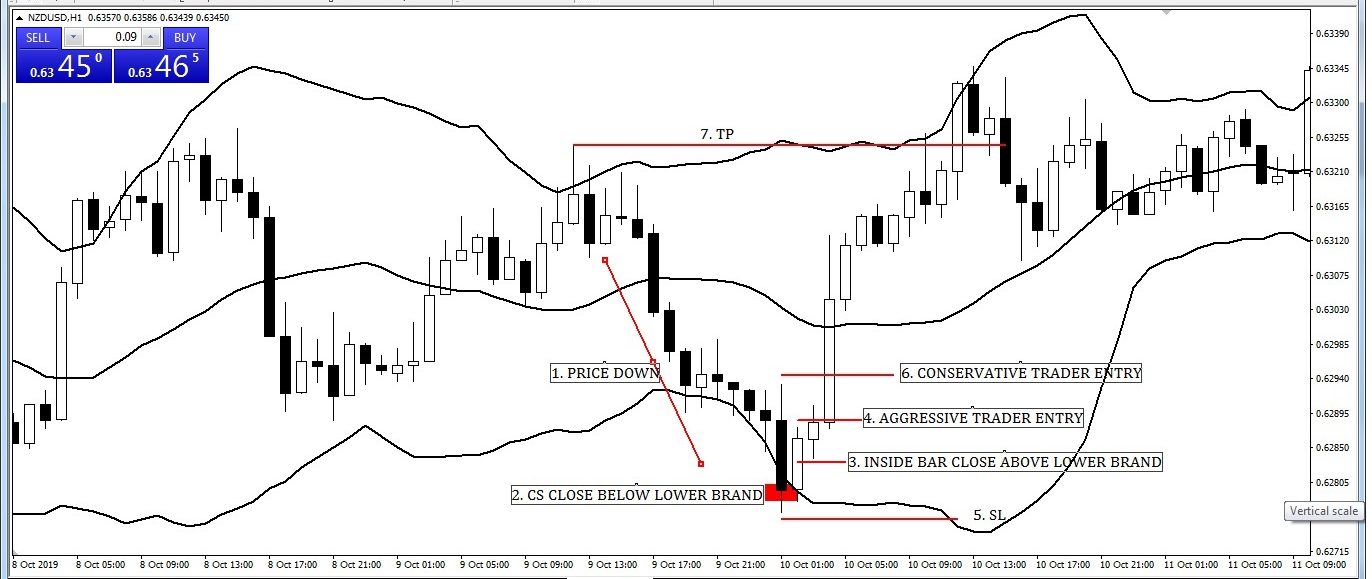
Image: Inside Bar Candlesticks with Bollinger Band Entry-Exit Strategy
Image point number – 1, After touched Bollinger Upper Band touched Price fall consecutively.
Image point number – 2, Price goes down consecutively with Bollinger lower Band. Bearish engulfing candlesticks created which also close below Bollinger lower Band.
Image point number – 3, Thereafter an inside bar candlestick created as a reversal candlestick. Its close price is above Bollinger lower Band. But we don’t enter here.
Image point number – 4, Aggressive trader put their buy stop order two to five pips above of the inside bar. As a conservative trader, we need more confirmation. Thus we have to wait for the mother bar break out. Because of few times inside bar candlesticks unable to breakout mother bar. After the failure of mother bar candlesticks, the inside bar does not act as a reversal candlestick. Ultimately stop loss hit which badly affects our strategy success ratio.
Image point number – 5, Aggressive trader put their stop loss two to five pips below of mother bar candle. More aggressive trader put their stop loss two to five pips below of inside bar.
Image point number – 6, Conservative trader put their buy stop order two to five pips above of the mother bar. When the buy stop hit they put their stop loss two to five pips below of mother bar candle.
Image point number – 7, Near Swing High or 1: 2 or 1 : 3 risk-reward ratio, Conservative or aggressive trader place TP.
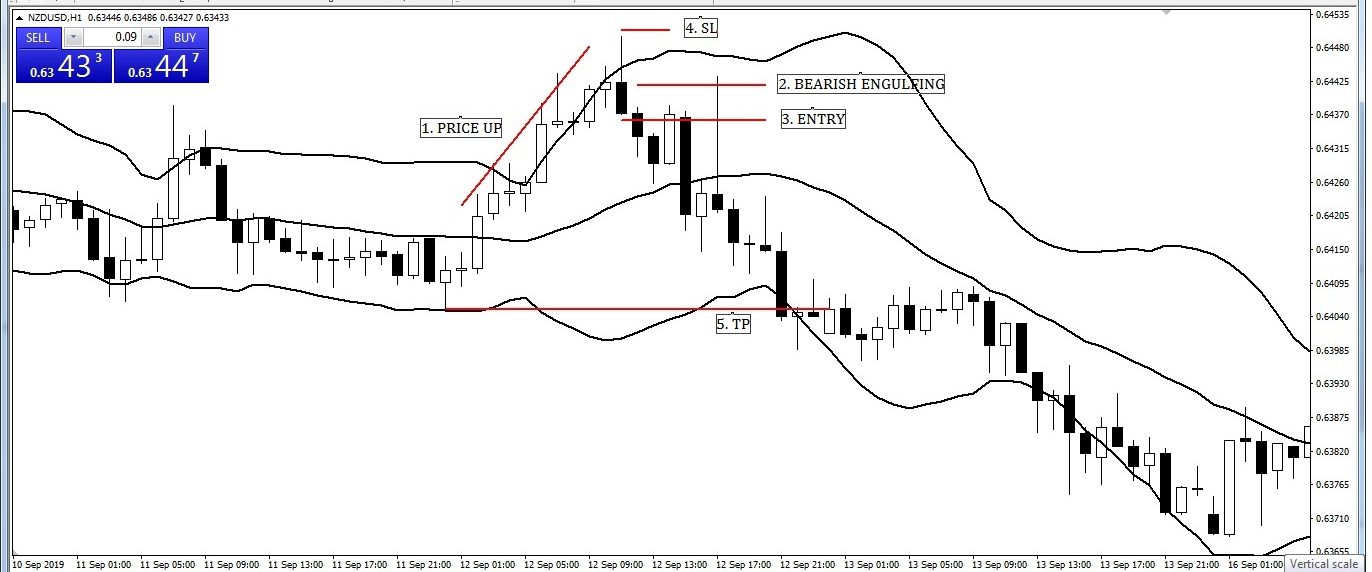
Image: Bearish Engulfing Candlesticks with Bollinger Band Entry-Exit Strategy
Image point number – 1, Price goes consecutively up.
Image point number – 2, Previous few candlesticks close above with Bollinger Upper Band. Thereafter create bearish engulfing candlesticks. The close price of bearish engulfing candlesticks is below the Bollinger Upper Band.
Image point number – 3, Two to five pips below of the bearish engulfing candlesticks, Aggressive or conservative trader put their sell stop order
Image point number – 4, Two to five pips above of the bearish engulfing candlesticks, Aggressive or conservative trader put their stop-loss order.
Image point number – 5, Near Swing low or 1: 2 or 1 : 3 risk-reward ratio, Conservative or aggressive trader place TP.
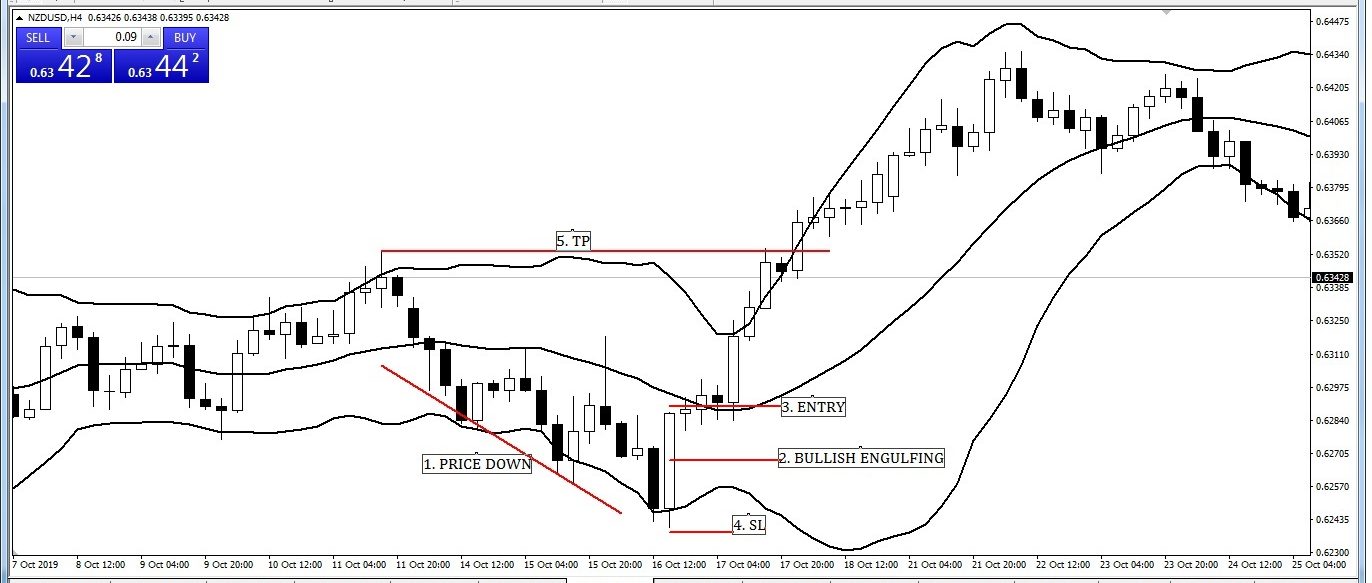
Image: Bullish Engulfing Candlesticks with Bollinger Band Entry-Exit Strategy
Image point number – 1, Price goes consecutively down after Bollinger Upper Band touched.
Image point number – 2, Bullish engulfing candlesticks created. Also its close price is above of the Bollinger Lower Band.
Image point number – 3, Two to five pips above of the bullish engulfing candlesticks, Aggressive or conservative trader put their buy stop order.
Image point number – 4, Two to five pips below of the bullish engulfing candlesticks, Aggressive or conservative trader put their stop-loss order.
Image point number – 5, Near Swing High or 1: 2 or 1 : 3 risk-reward ratio, Conservative or aggressive trader place TP.

Image: Pin Bar Candlesticks with Bollinger Band Entry-Exit Strategy
Image point number – 1, Price goes consecutively down.
Image point number – 2, Few candlesticks later pin bar created which close price is above Bollinger Lower Band.
Image point number – 3, Aggressive or conservative trader put their buy stop order two to five pips above of the pin bar candlesticks.
Image point number – 4, Aggressive or conservative trader put their stop-loss order two to five pips below of the pin bar candlesticks.
Image point number – 5, Near Swing High or 1: 2 or 1 : 3 risk-reward ratio, Conservative or aggressive trader place TP.

Image: Doji Candlesticks with Bollinger Band Entry-Exit Strategy
Image point number – 1, Price goes consecutively down.
Image point number – 2, Few candlesticks later Doji candlesticks created. Also its close price is above Bollinger Lower Band.
Image point number – 3, Two to five pips above of the Doji candlesticks, Aggressive or conservative trader put their buy stop order.
Image point number – 4, Two to five pips below of the Doji candlesticks, Aggressive or conservative trader put their stop-loss order.
Image point number – 5, Near Swing High or 1: 2 or 1 : 3 risk-reward ratio, Conservative or aggressive trader place TP.
Bollinger Band Strategies (Part-3):
Here we have discussed Trend Line Breakout with Bollinger Band Entry-Exit Strategy.
The below link is for your ready reference for details.
Bollinger Band Strategies (Part-3)

Image: Same Time Bollinger Middle Band and Trend Line Break Entry-Exit Strategy
Image point number – 1, We see a strong uptrend of price with Bollinger Upper Band touches and bottom. Draw trend line with connecting two more swing low. Also, we try to connect here four to five candlesticks low for a strong trend line.
Image point number – 2, Candlesticks break the downtrend line and close below Bollinger Middle Band. As per rules of the same time, Bollinger Middle Band and Trend Line break Entry-Exit Strategy, This is our entry candlesticks.
Image point number – 3, Aggressive or conservative trader put their SELL STOP order two to five pips below of the Bollinger Middle Band and trend line breaks down candlesticks.
Image point number – 4, After hitting BUY STOP order, Aggressive or conservative trader place STOP LOSS two to five pips above of Bollinger Middle Band. Also trend line breakdown candlesticks. Few traders place STOP LOSS two to five pips above of Bollinger Middle Band.
Image point number – 5, Near Swing High or 1: 2 or 1 : 3 risk-reward ratio, Conservative or aggressive trader place TP.
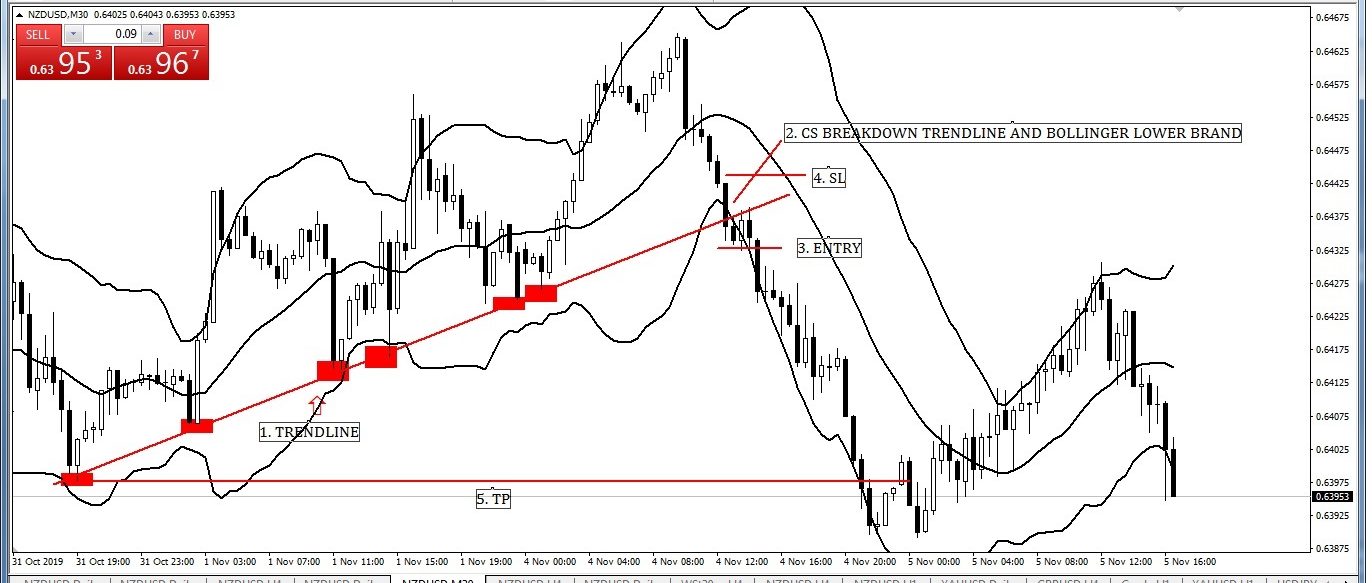
Image: Same Time Bollinger Lower Band, Trend Line Break down Entry-Exit Strategy
Image point number – 1, We see a strong uptrend of price with Bollinger Upper Band touches and bottom. Draw trend line with connecting two more swing low. Also, we try to connect here four to five candlesticks low for a strong trend line.
Image point number – 2, Candlesticks break the downtrend line and close below Bollinger Lower Band. As per rules of the same time, Bollinger Middle Band, Trend Line break Entry-Exit Strategy, This is our entry candlesticks.
Image point number – 3, Aggressive or conservative trader put their SELL STOP order two to five pips below of the Bollinger Lower Band and trend line breaks down candlesticks.
Image point number – 4, After hitting BUY STOP order, Aggressive or conservative trader place STOP LOSS two to five pips above of Bollinger Middle Band, trend line break down candlesticks. Few traders place STOP LOSS two to five pips above of Bollinger Middle Band.
Image point number – 5, Near Swing High or 1: 2 or 1 : 3 risk-reward ratio, Conservative or aggressive trader place TP.
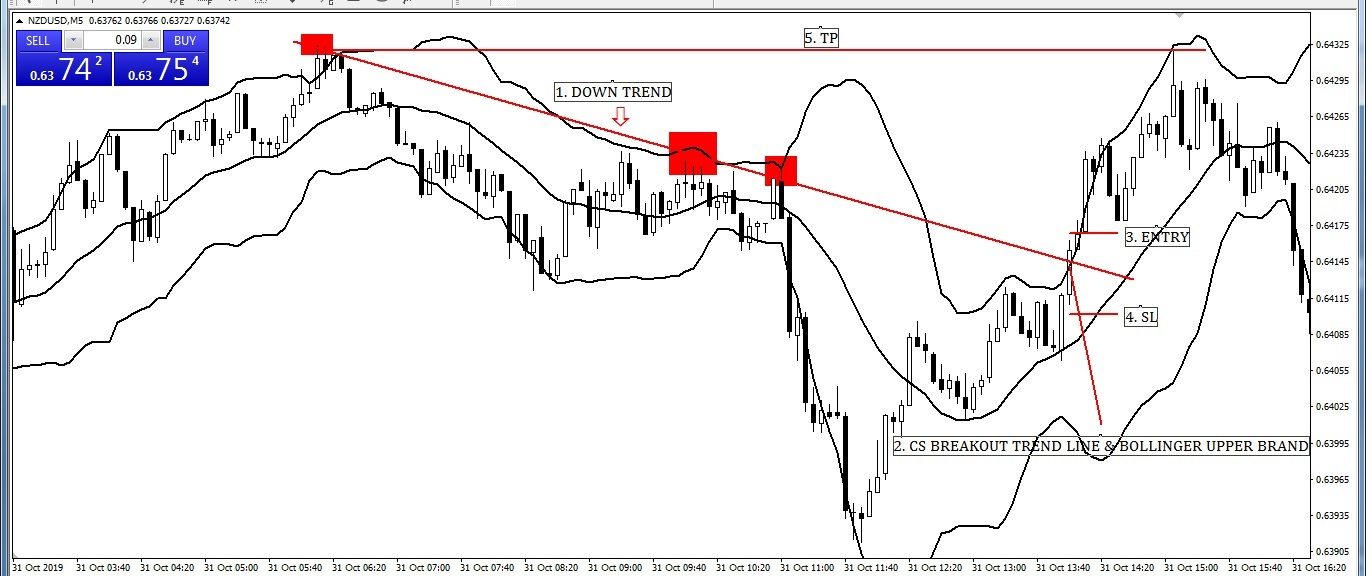
Image: Same Time Bollinger Upper Band, Trend Line Break out Entry-Exit Strategy
Image point number – 1, We see a strong downtrend of price with Bollinger Lower Band touches and tops. Draw trend line with connecting two more swings high. Also, we try to connect here four to five candlesticks low for a strong trend line.
Image point number – 2, Candlesticks breakout trend line and close below Bollinger Upper Band. As per rules of same time Bollinger Upper Band and Trend Line break Entry-Exit Strategy, This is our entry candlesticks.
Image point number – 3, Aggressive or conservative trader put their BUY STOP order two to five pips above of the Bollinger Lower Band and trend line breaks down candlesticks.
Image point number – 4, After hitting BUY STOP order, Aggressive or conservative trader place STOP LOSS two to five pips below of Bollinger Middle Band, trend line break down candlesticks. Few traders place STOP LOSS two to five pips below of Bollinger Middle Band.
Image point number – 5, Near Swing High or 1: 2 or 1 : 3 risk-reward ratio, Conservative or aggressive trader place TP.
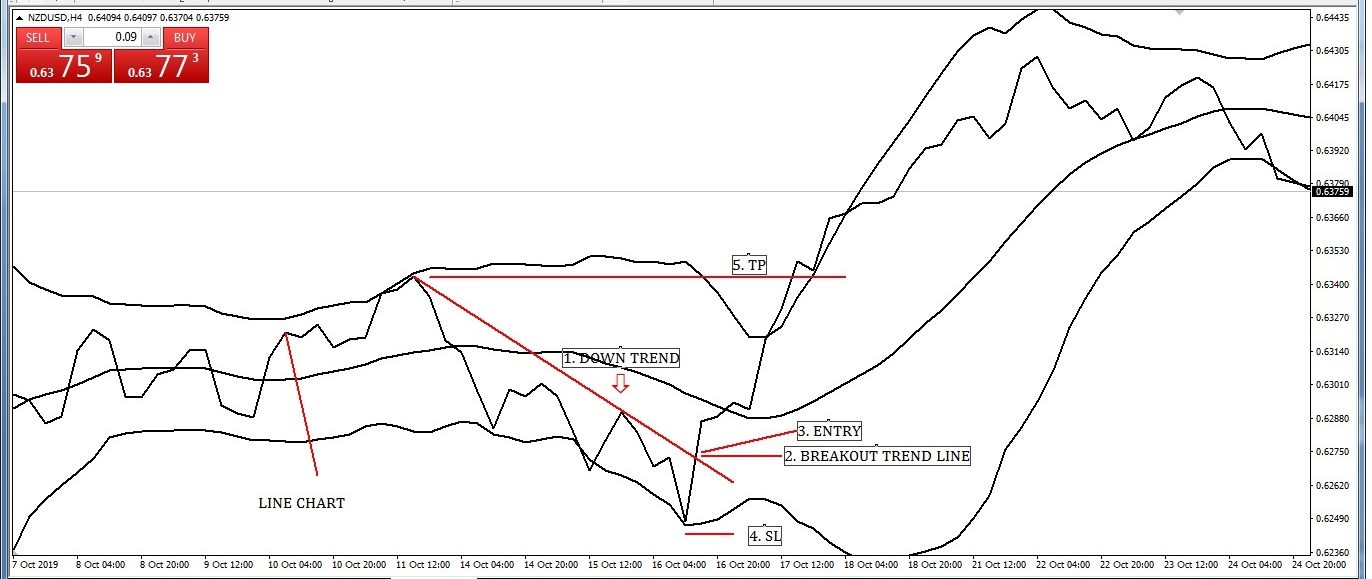
Image: Line Chart Trend Line Break out with Bollinger Band Entry-Exit Strategy
Image point number – 1, We see a strong downtrend of price with Bollinger Lower Band touches and tops. Draw trend line with connecting two more swings high.
Image point number – 2, Price break out trend line. As per rules of Line Chart Trend Line Break out with Bollinger Band Entry-Exit Strategy, Its time to enter.
Image point number – 3, Aggressive or conservative trader put their BUY STOP order two to five pips above of trend line.
Image point number – 4, After hitting BUY STOP order, Aggressive or conservative trader place STOP LOSS two to five pips below of swing low.
Image point number – 5, Near Swing High or 1: 2 or 1 : 3 risk-reward ratio, Conservative or aggressive trader place TP.
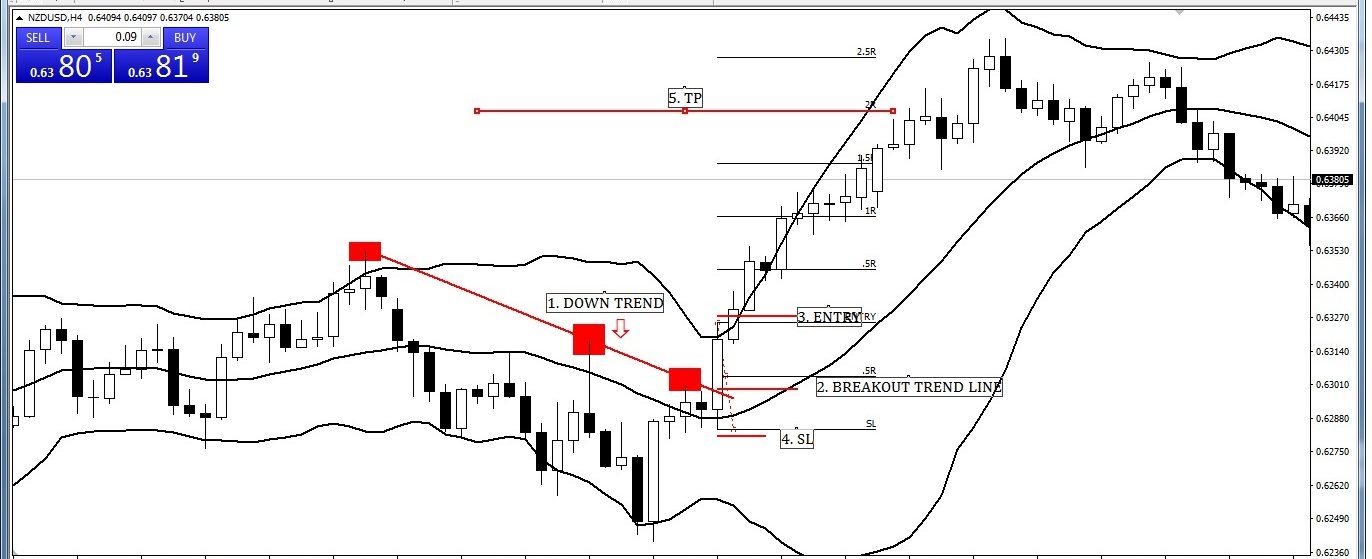
Image: Trend Line Break out with Bollinger Band Entry-Exit Strategy
Image point number – 1, We see a strong downtrend. Also, Its create with Bollinger Lower Band touches and few tops. Draw trend line with connecting two more swings high. Also, we try to connect here four to five candlesticks low for a strong trend line.
Image point number – 2, Candlesticks break out trend line. Also, close below Bollinger Upper Band. As per rules of same time Bollinger Upper Band and Trend Line break Entry-Exit Strategy, This is our entry candlesticks.
Image point number – 3, Aggressive or conservative trader put their BUY STOP order two to five pips above of the Bollinger Lower Band and trend line breaks down candlesticks.
Image point number – 4, After hitting BUY STOP order, Aggressive or conservative trader place STOP LOSS two to five pips below of trend line break down candlesticks.
Image point number – 5, Near Swing High or 1: 2 or 1 : 3 risk-reward ratio, Conservative or aggressive trader place TP.
Bollinger Band Strategies (Part-4):
Here we have discussed Swing Trading with Bollinger Middle Band (20 Simple Moving Average) Entry-Exit Strategy. The below link is for your ready reference for details.
Bollinger Band Strategies (Part-4)

Image: Swing Trading with Middle Band (20 Simple Moving Average) Bollinger Band Entry-Exit Strategy with Breakout Structure.
Image point number – 1, Market is fully sideways. As a swing trader, we have to wait for breakout sideways either up or down.
Image point number – 2, Candlesticks breakout sideways. This time as a swing trader we have to wait for price come back 20 SMA of Bollinger Middle Band.
Image point number – 3, Candlesticks come back to 20 SMA of Bollinger Middle Band thus we have to wait for reversal candlesticks pattern which must close above 20 SMA of Bollinger Middle Band.
Image point number – 4, Aggressive or conservative trader put their BUY STOP order two to five pips above of this reversal candlestick.
Image point number – 5, After hitting BUY STOP order, Aggressive trader place STOP LOSS two to five pips below of reversal candlestick. Conservative trader place STOP LOSS two to five pips below of swing low.
Image point number – 6, Near Swing High or 1: 2 or 1 : 3 risk-reward ratio, Conservative or aggressive trader place TP.
Image point numbers – 7, 8, and 9, Another swing trading entry and exit opportunity as per rules.
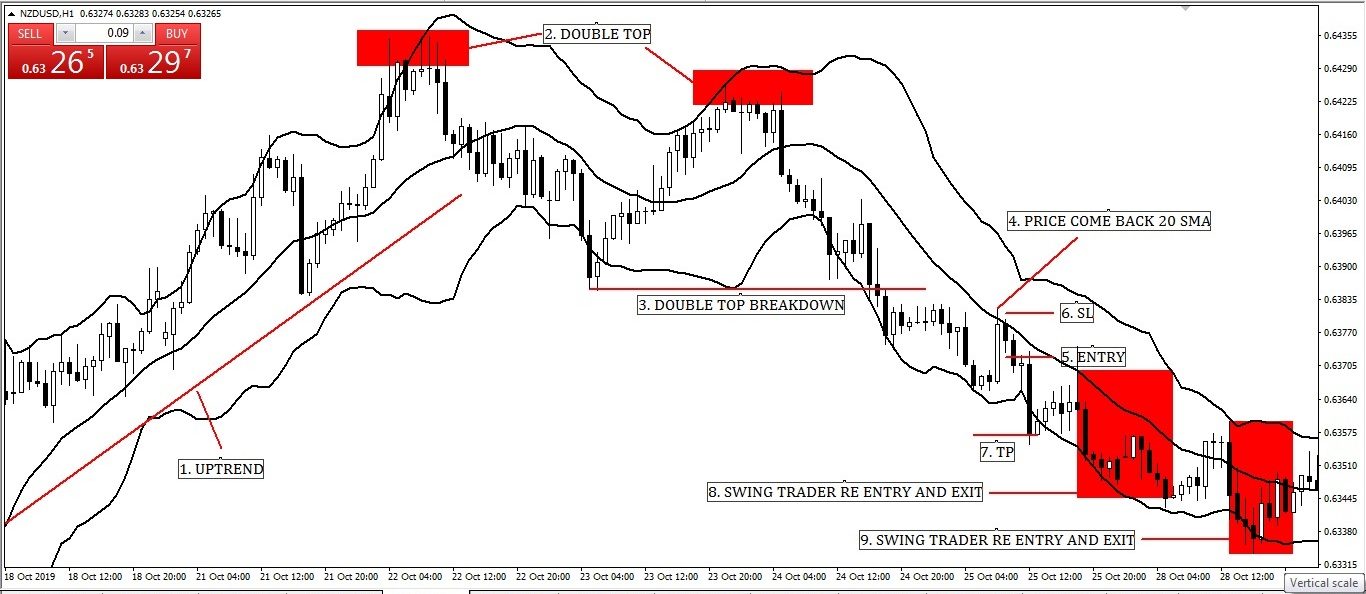
Image: Swing Trading with Middle Band (20 Simple Moving Average) Bollinger Band Entry-Exit Strategy with Chart Pattern Structure.
Image point number – 1, We see the market is fully uptrend. Its time to wait to create any chart pattern.
Image point number – 2, Double top pattern created but as a swing trader, we have nothing to do.
Image point number – 3, Candlesticks break down double top neck line but as a swing trader, we do not enter here. We have to wait for price come back 20 SMA of Bollinger Middle Band.
Image point number – 4, At last candlesticks come back to 20 SMA of Bollinger Middle Band. Its time to wait for reversal candlesticks pattern which must close below 20 SMA of Bollinger Middle Band.
Image point number – 5, Aggressive or conservative trader put their SELL STOP order two to five pips below of this reversal candlestick.
Image point number – 6, After hitting BUY STOP order, Aggressive trader place STOP LOSS two to five pips above of reversal candlestick. Conservative trader place STOP LOSS two to five pips above of swing high.
Image point number – 7, Near Swing Low or 1: 2 or 1 : 3 risk-reward ratio, Conservative or aggressive trader place TP.
Image point number – 8 and 9, Another swing trading entry and exit opportunity as per rules.
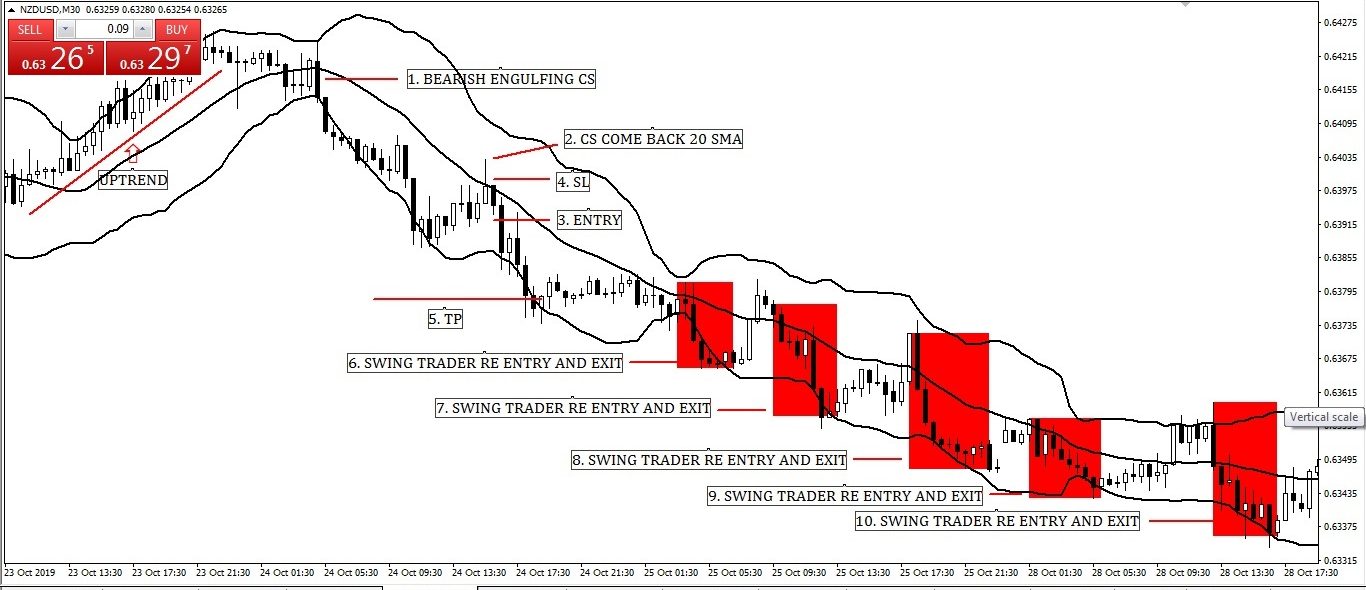
Image: Swing Trading with Middle Band (20 Simple Moving Average) Bollinger Band Entry-Exit Strategy with Candlesticks Pattern Structure.
Image point number – 1, Market is fully uptrend. Time to wait to create any reversal candlesticks pattern.
Bearish engulfing candlesticks pattern created but as a swing trader, we have nothing to do.
Image point number – 2, Candlesticks come back to 20 SMA of Bollinger Middle Band. We have to wait for a reversal candlesticks pattern which must close below 20 SMA of Bollinger Middle Band.
Image point number – 3, Aggressive or conservative trader put their SELL STOP order two to five pips below of this reversal candlestick.
Image point number – 4, After hitting BUY STOP order, Aggressive trader place STOP LOSS two to five pips above of reversal candlestick. Conservative trader place STOP LOSS two to five pips above of swing high.
Image point number – 5, Near Swing Low or 1: 2 or 1 : 3 risk-reward ratio, Conservative or aggressive trader place TP.
Image point number – 6, 7, 8, 9, and 10, Another swing trading entry and exit opportunity as per rules.
Bollinger Band Strategies (Part-5):
Here we have discussed 200 Simple Moving Average with Bollinger Band Entry-Exit Strategy. The below link is for your ready reference for details.
Bollinger Band Strategies (Part-5)

Image: 200 Simple Moving Averages Re-test with Bollinger Band Entry-Exit Strategy
Image point number – 1, Candlesticks breakout 200 Simple Moving Averages and Bollinger Upper Band but as per rules, we have nothing to do. Time to wait for 200 Simple Moving Averages retest.
Image point number – 2, Candlesticks completed a retest of 200 Simple Moving Averages. Now time to wait for reversal candlesticks to entry.
Image point number – 3, Aggressive or conservative trader put their BUY STOP order two to five pips above of this reversal candlestick.
Image point number – 4, After hitting BUY STOP order, Aggressive trader place STOP LOSS two to five pips below of reversal candlestick. Conservative trader place STOP LOSS two to five pips below of swing low.
Image point number – 5, Near Swing High or 1: 2 or 1 : 3 risk-reward ratio, Conservative or aggressive trader place TP.
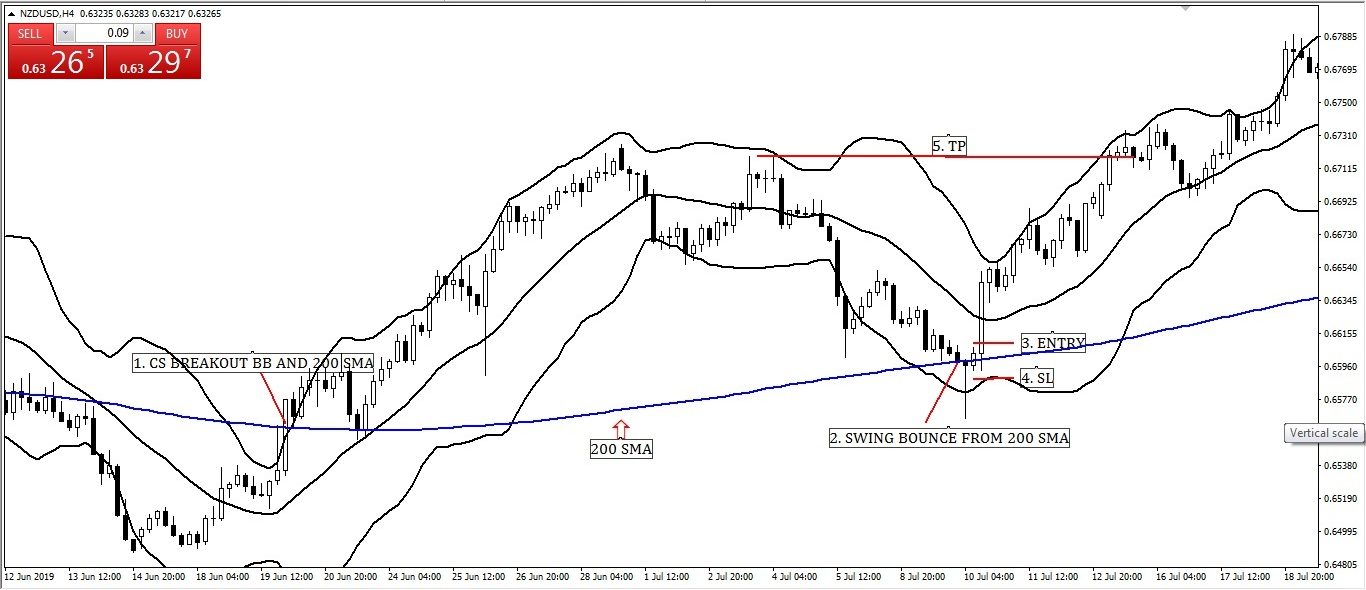
Image: 200 Simple Moving Averages swing with Bollinger Band Entry-Exit Strategy
Image point number – 1, Candlesticks breakout 200 Simple Moving Averages and Bollinger Upper Band so as per rules, This time we have nothing to do. Time to wait for 200 Simple Moving Averages retest. 200 Simple Moving Averages retest/pullback trader completed entry and exit when retest completed.
As a 200 Simple Moving Averages swing with Bollinger Band, We must have to wait for price swing from 200 Simple Moving Averages.
Image point number – 2, Candlesticks come back 200 Simple Moving Averages. Time to wait for reversal candlesticks to entry.
Image point number – 3, Aggressive or conservative trader put their BUY STOP order two to five pips above of this reversal candlestick.
Image point number – 4, After hitting BUY STOP order, Aggressive trader place STOP LOSS two to five pips below of reversal candlestick. Conservative trader place STOP LOSS two to five pips below of swing low.
Image point number – 5, Near Swing High or 1: 2 or 1 : 3 risk-reward ratio, Conservative or aggressive trader place TP.
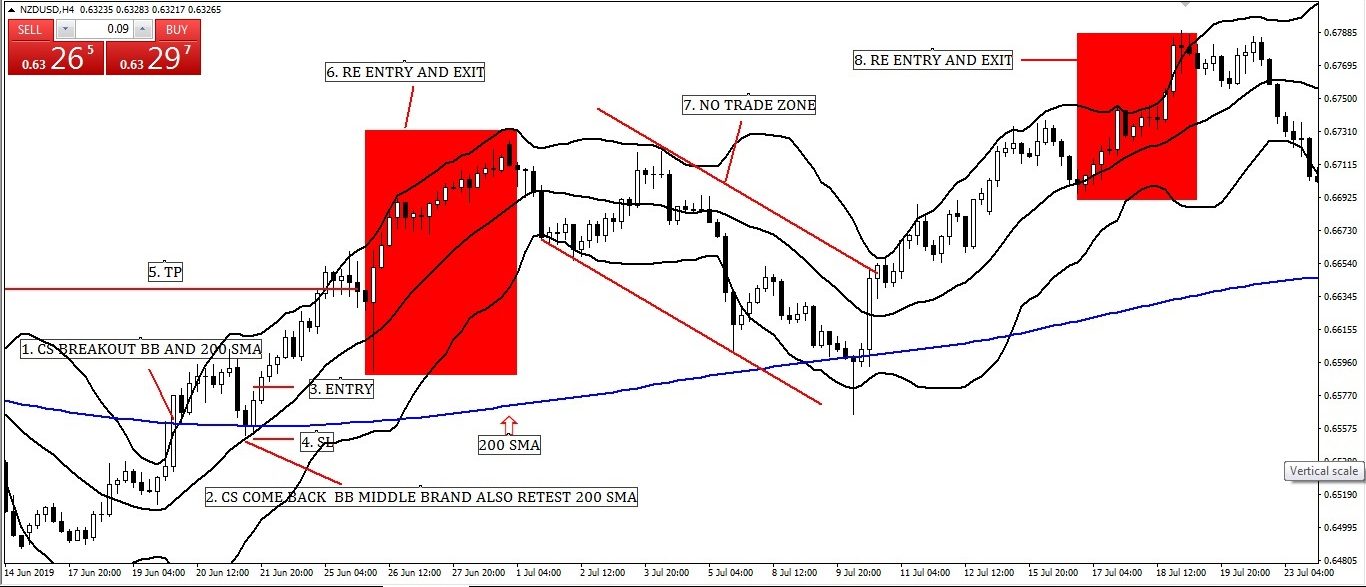
Image: 200 Simple Moving Averages with Bollinger Middle Band Swing Entry-Exit Strategy
Image point number – 1, Candlesticks breakout 200 Simple Moving Averages and Bollinger Middle Band but as per strategy, We have to wait for candlesticks come back Bollinger Middle Band and 200 Simple Moving Averages retest.
For your kind information, 200 Simple Moving Averages retest is not mandatory for this strategy
Image point number – 2, Candlesticks come back Bollinger Middle Band and retest 200 Simple Moving Averages and for Its confluence which gives us extra confidence to enter. Now time to wait for reversal candlesticks to entry.
Image point number – 3, Aggressive or conservative trader put their BUY STOP order two to five pips above of this reversal candlestick.
Image point number – 4, After hitting BUY STOP order, Aggressive trader place STOP LOSS two to five pips below of reversal candlestick. Conservative trader place STOP LOSS two to five pips below of swing low.
Image point number – 5, Near Swing High or 1: 2 or 1 : 3 risk-reward ratio, Conservative or aggressive trader place TP.
Image point number – 6, Re-entry, and exit opportunity.
Image point number – 7, NO TRADING ZONE. As per 200 Moving Average rules, we never sell above of 200 Moving Average.
Image point number – 8, Another re-entry and exit opportunity.
Bollinger Band Strategies (Part-6):
Here we have discussed Walking with Bollinger Band Entry-Exit Strategy. The below link is for your ready reference for details.
Bollinger Band Strategies (Part-6)
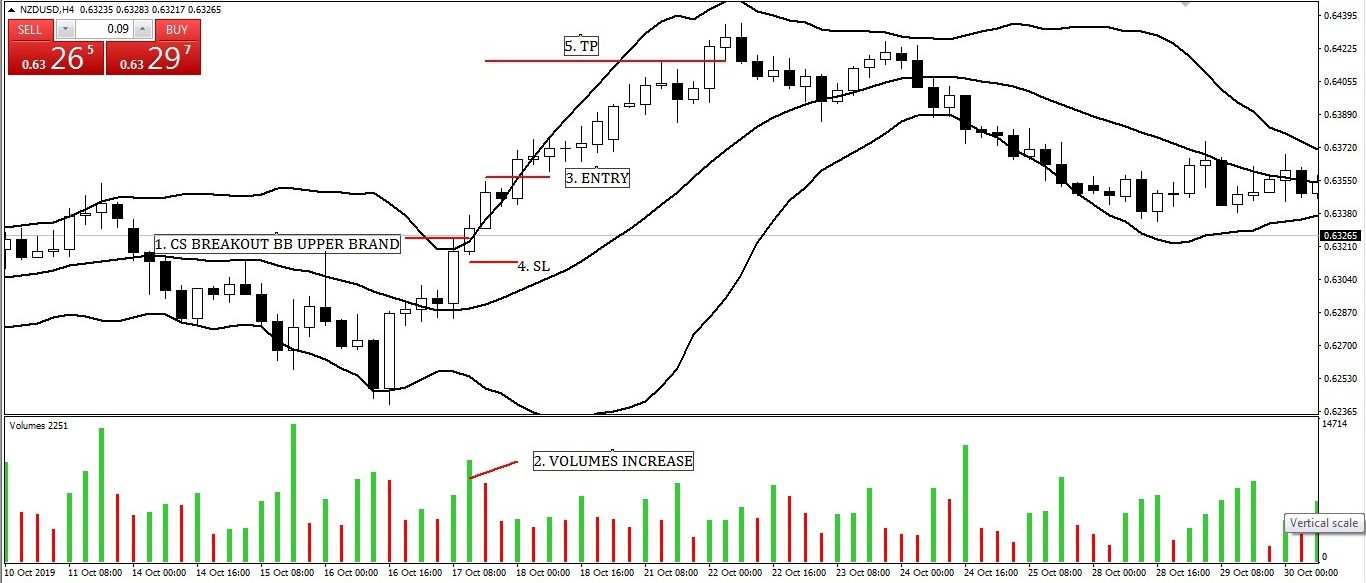
Image: Walking with Bollinger Upper Band Entry-Exit Strategy
Image point number – 1, Candlesticks breakout Bollinger Upper Band but at this time we have nothing to do. Time to wait for 2nd candlesticks close above Bollinger Upper Band.
Image point number – 2, Volumes increase of Bollinger Upper Band breakout candlesticks so its confirm that something big will happened.
Image point number – 3, Aggressive or conservative trader put their BUY STOP order two to five pips above of 2nd candlesticks close above Bollinger Upper Band.
Image point number – 4, After hitting BUY STOP order, Aggressive or conservative traders place STOP LOSS two to five pips below of previous candlesticks of entry candlestick.
Image point number – 5, Near Swing High or 1: 2 or 1 : 3 risk-reward ratio, Conservative or aggressive trader place TP.
Bollinger Band Strategies (Part-7):
Here we have discussed Ascending Triangle with Bollinger Band Entry-Exit Strategy. And Descending Triangle with Bollinger Band Entry-Exit Strategy. Also Symmetrical Triangle with Bollinger Band Entry-Exit Strategy.
The below link is for your ready reference for details.
Bollinger Band Strategies (Part-7)
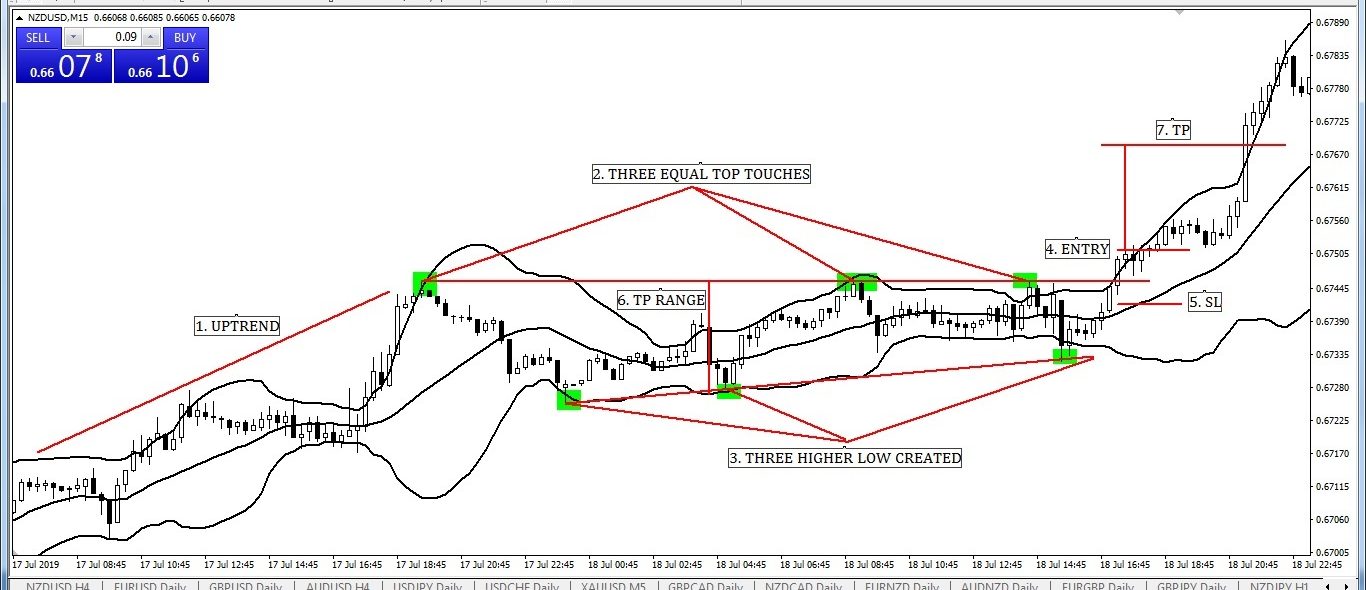
Image: Ascending Triangle with Bollinger Band Entry-Exit Strategy
Image point number – 1, Strong uptrend with few higher high.
Image point number – 2, After strong uptrend its time to correction and price touches three times in previous high but failure to breakout.
Image point number – 3, Price created three higher low also. We found an ascending triangle in the chart. Also, the price did not breakdown successfully Bollinger Lower Band. Time to wait for a breakout.
Image point number – 4, Aggressive or conservative trader put their BUY STOP order two to five pips above of ascending triangle breakout candlesticks. Ascending triangle breakout candlesticks breakout also Bollinger Upper Band which is confluence and it shown extra confidence for BUY.
Image point number – 5, After hitting BUY STOP order, Aggressive trader place STOP LOSS two to five pips below of ascending triangle breakout candlesticks. Conservative traders place STOP LOSS two to five pips below of the ascending triangle lower channel.
Image point number – 6, As per ascending triangle exit rules now we measure take profit range.
Image point number – 7, Near Swing High or 1: 2 or 1 : 3 risk-reward ratio, Conservative or aggressive trader place TP.

Image: Descending Triangle with Bollinger Band Entry-Exit Strategy
Image point number – 1, Strong downtrend with few lower low.
Image point number – 2, After a strong downtrend its time to correction and price touches two times in previous low but failed to break down.
Image point number – 3, Price created four lower high also. We found a descending triangle in the chart. Also, the price did not breakout successfully Bollinger Upper Band. Time to wait for break down.
Image point number – 4, Aggressive or conservative trader put their SELL STOP order two to five pips below of the descending triangle break down candlesticks. Descending triangle breakdown candlesticks breakout also Bollinger Lower Band which confluence had shown extra confidence for SELL.
Image point number – 5, After hitting BUY STOP order, Aggressive trader place STOP LOSS two to five pips above of descending triangle break down candlesticks. Conservative traders place STOP LOSS two to five pips above of descending triangle upper channel.
Image point number – 6, As per descending triangle exit rules now we measure take profit range.
Image point number – 7, Near Swing Low or 1: 2 or 1 : 3 risk-reward ratio, Conservative or aggressive trader place TP.
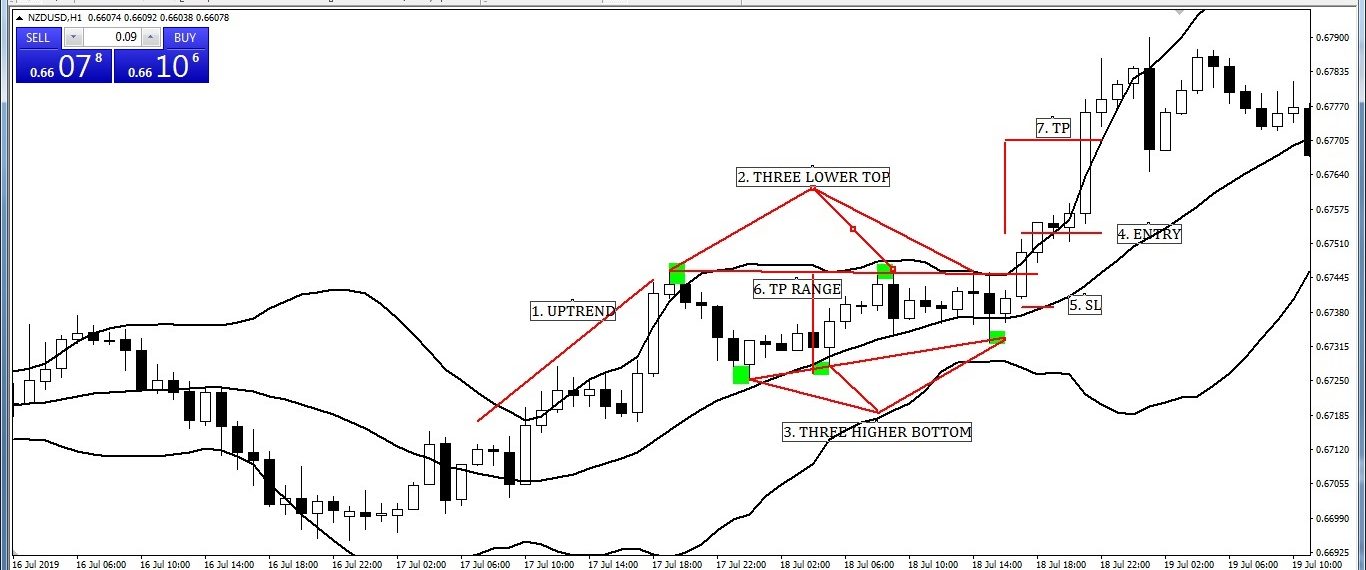
Image: Symmetrical Triangle with Bollinger Band Entry-Exit Strategy (BUY)
Image point number – 1, Strong uptrend with few higher high.
Image point number – 2, After strong uptrend its time to correction and Price created three times in lower top but failed to breakout.
Image point number – 3, Price created three times higher bottom also. We found ascending triangle in the chart. Also, price did not breakdown successfully Bollinger Lower Band. Now we have to wait for a breakout.
Image point number – 4, Two to five pips above of ascending triangle breakout candlesticks, Aggressive or conservative trader put their BUY STOP order.
Ascending triangle breakout candlesticks also breakout Bollinger Upper Band which is confluence and its shown extra confidence for BUY.
Image point number – 5, After hitting BUY STOP order, Aggressive trader place STOP LOSS two to five pips below of ascending triangle breakout candlesticks. Conservative traders place STOP LOSS two to five pips below of the ascending triangle lower channel.
Image point number – 6, As per ascending triangle exit rules now we measure take profit range.
Image point number – 7, Near Swing High or 1: 2 or 1 : 3 risk-reward ratio, Conservative or aggressive trader place TP.

Image: Symmetrical Triangle with Bollinger Band Entry-Exit Strategy (SELL)
Image point number – 1, Strong downtrend with few lower low.
Image point number – 2, After strong downtrend its time to reversal, and Price created two times higher bottom which means indecision.
Image point number – 3, Price created two times lower top also which means trend pause. We found a symmetrical triangle in the chart. Also, we have to wait for break down.
Image point number – 4, Aggressive or conservative trader put their SELL STOP order two to five pips below of symmetrical triangle break down candlesticks.
Image point number – 5, After hitting BUY STOP order, Aggressive trader place STOP LOSS two to five pips above of symmetrical triangle break down candlesticks. Conservative traders place STOP LOSS two to five pips above of symmetrical triangle upper channel.
Image point number – 6, As per symmetrical triangle exit rules now we measure take profit range.
Image point number – 7, Near Swing Low or 1: 2 or 1 : 3 risk-reward ratio, Conservative or aggressive trader place TP.
Bollinger Band Strategies (Part-8):
Here we have discussed Flag Pattern with Bollinger Band Entry-Exit Strategy. Also Channel Triangle with Bollinger Band Entry-Exit Strategy.
The below link is for your ready reference for details.
Bollinger Band Strategies (Part-8):
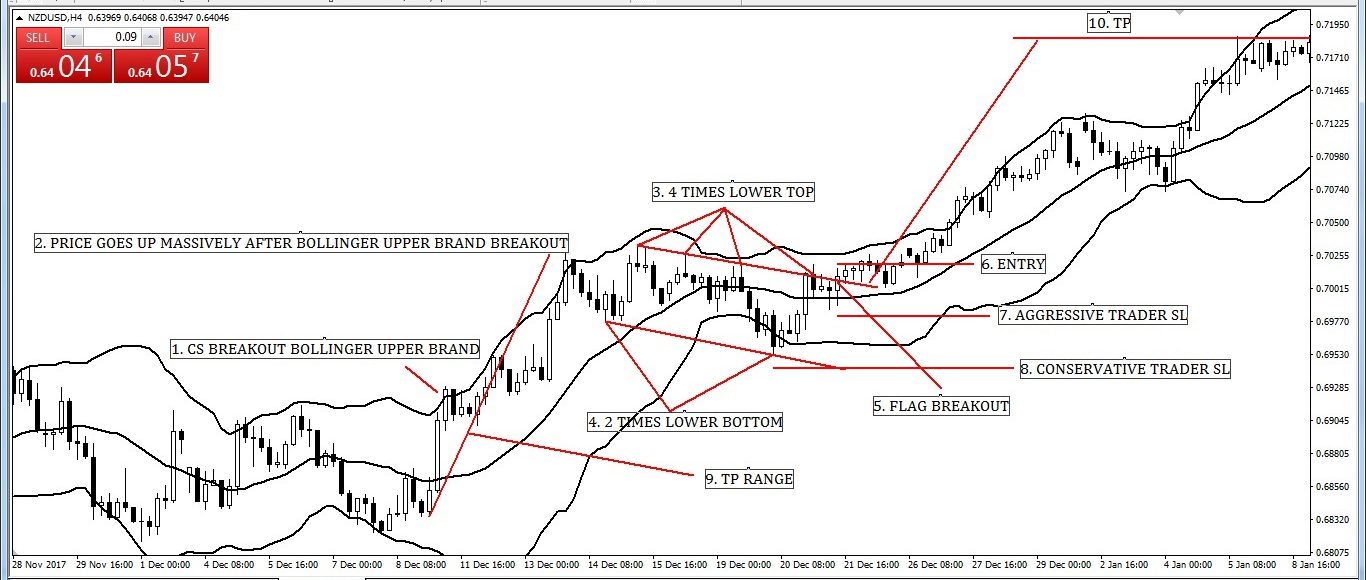
Image: Bullish Flag Pattern with Bollinger Band Entry-Exit Strategy
Image point number – 1, Candlesticks breakout Bollinger Upper Band that means its uptrend. Its time to wait and watch as per Bullish Flag Pattern with Bollinger Band Entry-Exit Strategy rules.
Image point number – 2, Strong uptrend created with price goes up massively.
Image point number – 3, After strong uptrend time to correction. Also, Price created four times lower tops but failed to breakout.
Image point number – 4, Price created two times lower bottom and we found bullish flag pattern in the chart. Now time to wait for a breakout.
Image point number – 5, At last, price breakout bullish flag pattern, and as per Bullish Flag Pattern with Bollinger Band Entry-Exit Strategy rules its time to buy. Also, we have to wait for candlesticks close above the channel which indicates a successful breakout.
Image point number – 6, Aggressive or conservative trader put their BUY STOP order two to five pips above of Bullish Flag Pattern breakout candlesticks.
Image point number – 7, After hitting BUY STOP order, Aggressive trader place STOP LOSS two to five pips below of Bullish Flag Pattern breakout candlesticks.
Image point number – 8, Conservative traders place STOP LOSS two to five pips below of Bullish Flag Pattern lower channel.
Image point number – 9, As per Bullish Flag Pattern exit rules now we measure take profit range.
Image point number – 10, Near Swing High or 1: 2 or 1 : 3 risk-reward ratio, Conservative or aggressive trader place TP.

Image: Bearish Flag Pattern with Bollinger Band Entry-Exit Strategy
Image point number – 1, We see candlesticks break down Lower Band of Bollinger that means its downtrend. Its time to wait and watch as per Bearish Flag Pattern with Bollinger Band Entry-Exit Strategy rules.
Image point number – 2, Strong downtrend created with price goes down massively.
Image point number – 3, After strong downtrend price time to reversal. Also, Price created two times higher top.
Image point number – 4, Price created two times higher bottom and we concretely found bullish flag pattern in the chart. Now we time to wait to break down.
Image point number – 5, At last, price break down bearish flag pattern, and as per Bearish Flag Pattern with Bollinger Band Entry-Exit Strategy rules its time to sell. Also, we have to wait for candlesticks close below the channel which indicates a successful breakdown.
Image point number – 6, Two to five pips below of Bearish Flag Pattern break down candlesticks, Aggressive or conservative trader put their SELL STOP order.
Image point number – 7, Two to five pips above of Bearish Flag Pattern break down candlesticks, After hitting BUY STOP order, Aggressive trader place STOP LOSS.
Image point number – 8, Conservative traders place STOP LOSS two to five pips above of Bearish Flag Pattern lower channel.
Image point number – 9, As per Bearish Flag Pattern exit rules now we measure take profit range.
Image point number – 10, Near Swing High or 1: 2 or 1 : 3 risk-reward ratio, Conservative or aggressive trader place TP.
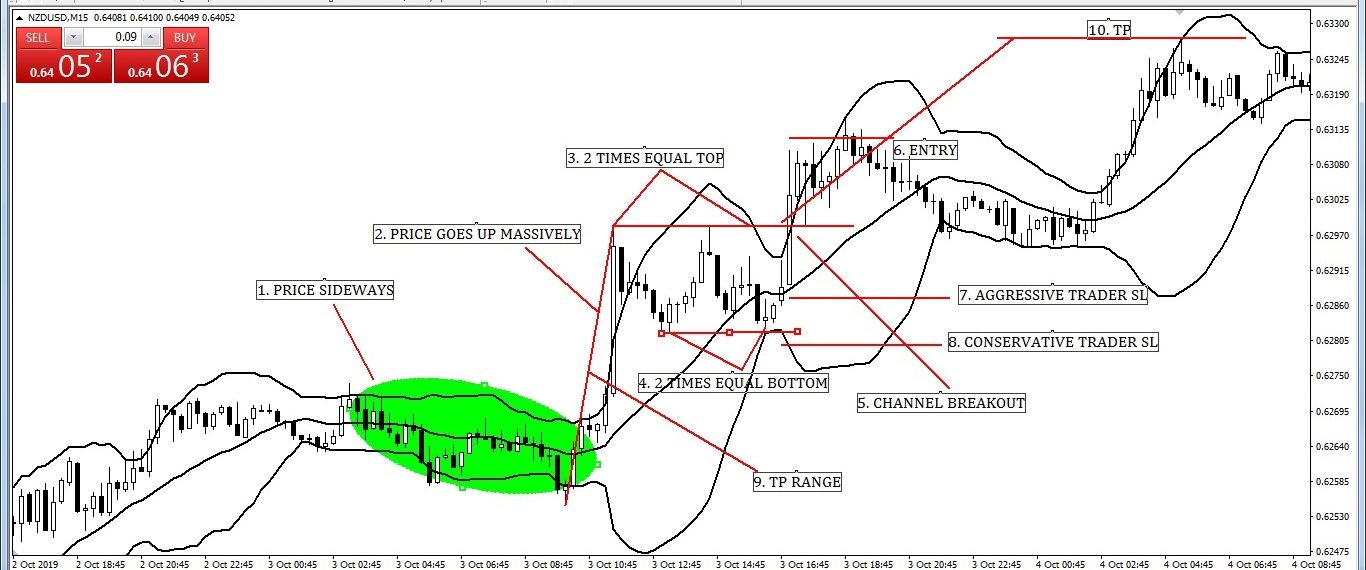
Image: Bullish Channel Pattern with Bollinger Band Entry-Exit Strategy
Image point number – 1, We see candlesticks sideways thus its time to wait and watch as per Bullish channel Pattern with Bollinger Band Entry-Exit Strategy rules.
Image point number – 2, Strong uptrend created with price goes up massively.
Image point number – 3, After strong uptrend time to correction. Here Price created two times equal tops but failed to breakout.
Image point number – 4, Price created two times equal bottom and we found bullish channel pattern in the chart. Now time to wait for a breakout.
Image point number – 5, At last, price breakout bullish channel pattern so as per Bullish channel Pattern with Bollinger Band Entry-Exit Strategy rules its time to buy. But time to wait for candlesticks close above channel which indicates a successful breakout.
Image point number – 6, Aggressive or conservative trader put their BUY STOP order two to five pips above of Bullish channel Pattern breakout candlesticks.
Image point number – 7, Two to five pips below of Bullish channel Pattern breakout candlesticks, After hitting BUY STOP order, Aggressive trader place STOP LOSS.
Image point number – 8, Two to five pips below of Bullish channel Pattern lower channel, Conservative traders place STOP LOSS.
Image point number – 9, As per Bullish channel Pattern exit rules, we measure take profit range.
Image point number – 10, Near Swing High or 1: 2 or 1 : 3 risk-reward ratio, Conservative or aggressive trader place TP.
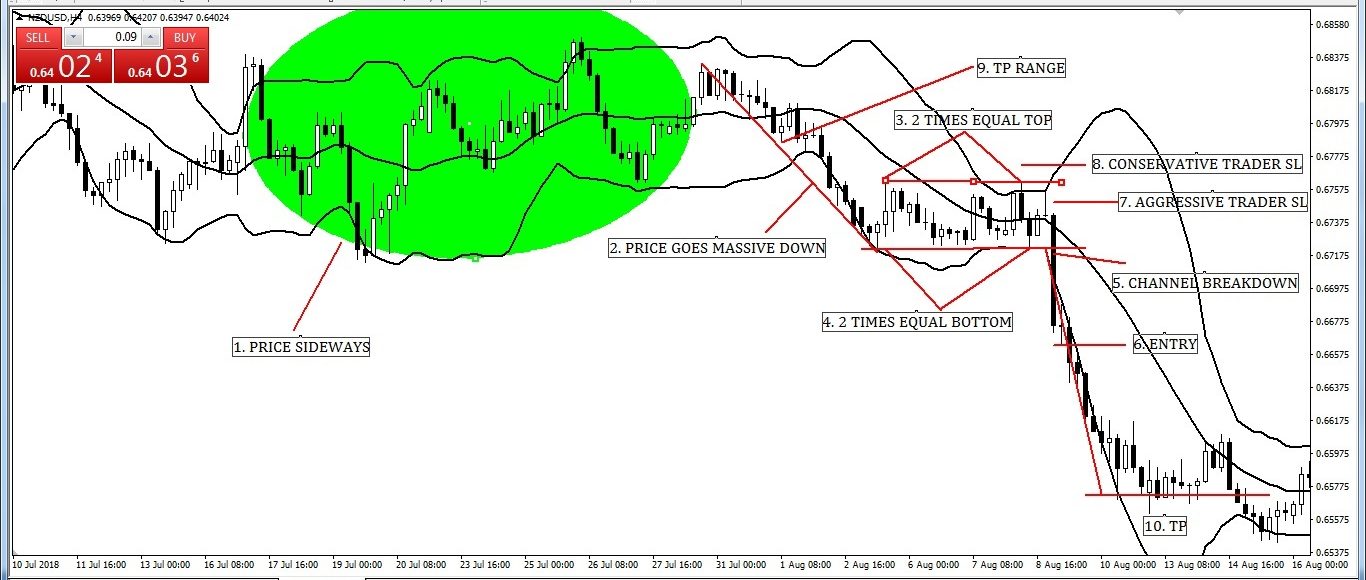
Image: Bearish channel Pattern with Bollinger Band Entry-Exit Strategy
Image point number – 1, We see candlesticks are sideways thus its time to wait and watch as per Bearish channel Pattern with Bollinger Band Entry-Exit Strategy rules.
Image point number – 2, Strong downtrend created with price goes down massively.
Image point number – 3, After strong downtrend time to reversal. Here Price created two times parallel top.
Image point number – 4, Price created two times parallel bottom and we found bullish flag pattern in the chart. Now we have to wait for break down.
Image point number – 5, At last price break down bearish channel pattern so as per Bearish channel Pattern with Bollinger Band Entry-Exit Strategy rules its time to sell. But time to wait for candlesticks close below channel which indicates successful breakdown.
Image point number – 6, Aggressive or conservative trader put their SELL STOP order two to five pips below of Bearish channel Pattern break down candlesticks.
Image point number – 7, After hitting BUY STOP order, Aggressive trader place STOP LOSS two to five pips above of Bearish channel Pattern break down candlesticks.
Image point number – 8, Conservative traders place STOP LOSS two to five pips above of Bearish channel Pattern lower channel.
Image point number – 9, As per Bearish channel Pattern exit rules, we measure take profit range.
Image point number – 10, Near Swing High or 1: 2 or 1 : 3 risk-reward ratio, Conservative or aggressive trader place TP.
Bollinger Band Strategies (Part-9):
Here we have discussed the Golden Cross with Bollinger Band Entry-Exit Strategy. Also Death Cross with Bollinger Band Entry-Exit Strategy.
The below link is for your ready reference for details.
Bollinger Band Strategies (Part-9):
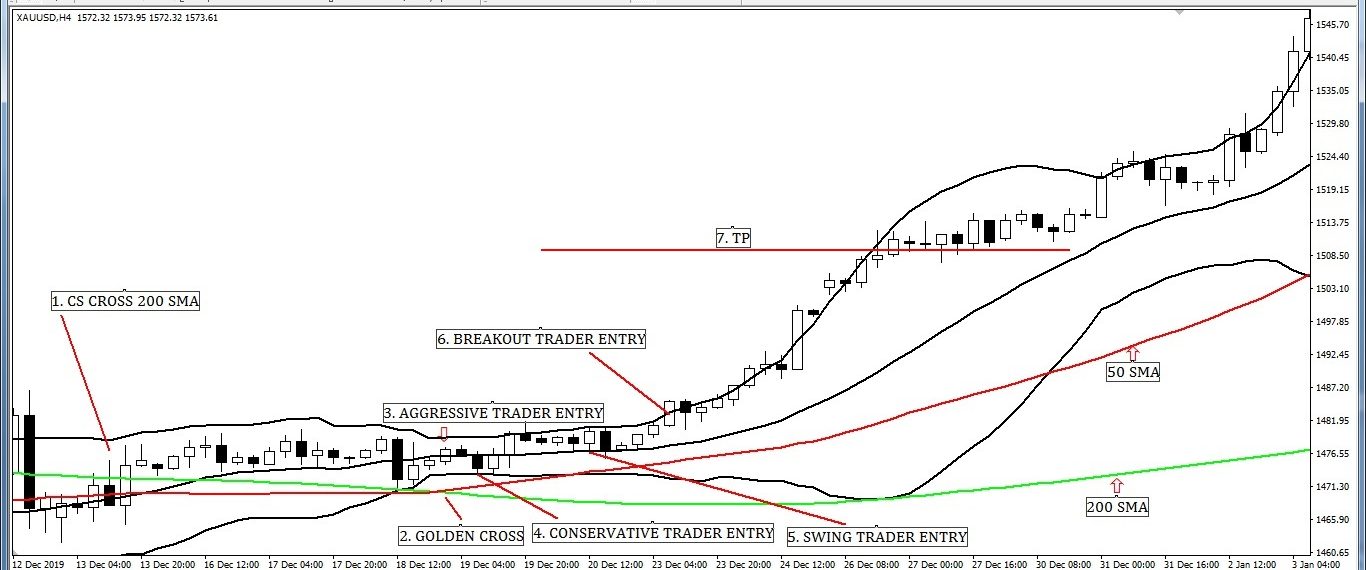
Image: Various Entry and Exit Strategy when Golden Cross with Bollinger Band.
Image point number – 1, We see candlesticks close above 200 Moving Average which means its uptrend. Its time to wait and watch as per various Entry and Exit Strategy when Golden Cross.
Image point number – 2, Maintaining sideways above 200 Simple Moving Average where candlesticks never close below 200 Simple Moving Average and never close below Bollinger Lower Band. Price is till now bullish and we have to wait for Golden Cross.
At last Golden Cross created and we hope that price will go up massively.
Image point number – 3, Aggressive trader put their BUY STOP order two to five pips above of Golden Crossing candlesticks.
After hitting BUY STOP order, Aggressive trader place STOP LOSS two to five pips below of 50 Simple Moving Average.
Image point number – 4, Bollinger Band user Conservative trader put their BUY LIMIT order with Bollinger Lower Band.
After hit BUY LIMIT order Conservative trader place STOP LOSS two to five pips below of 50 Simple Moving Average.
Image point number – 5, Bollinger Band user Swing trader put their BUY LIMIT order with Bollinger Middle Band.
After hit BUY LIMIT order swing trader place STOP LOSS two to five pips below of 50 Simple Moving Average or Bollinger Lower Band which different more.
Image point number – 6, Bollinger Band user Breakout trader put their BUY STOP order Bollinger Upper Band breakout candlesticks.
After hitting BUY STOP order, Breakout trader place STOP LOSS two to five pips below of 50 Simple Moving Average or Bollinger Lower Band which different more.
Image point number – 7, Near Swing High or 1: 2 or 1 : 3 risk-reward ratio, Conservative or aggressive trader place TP.
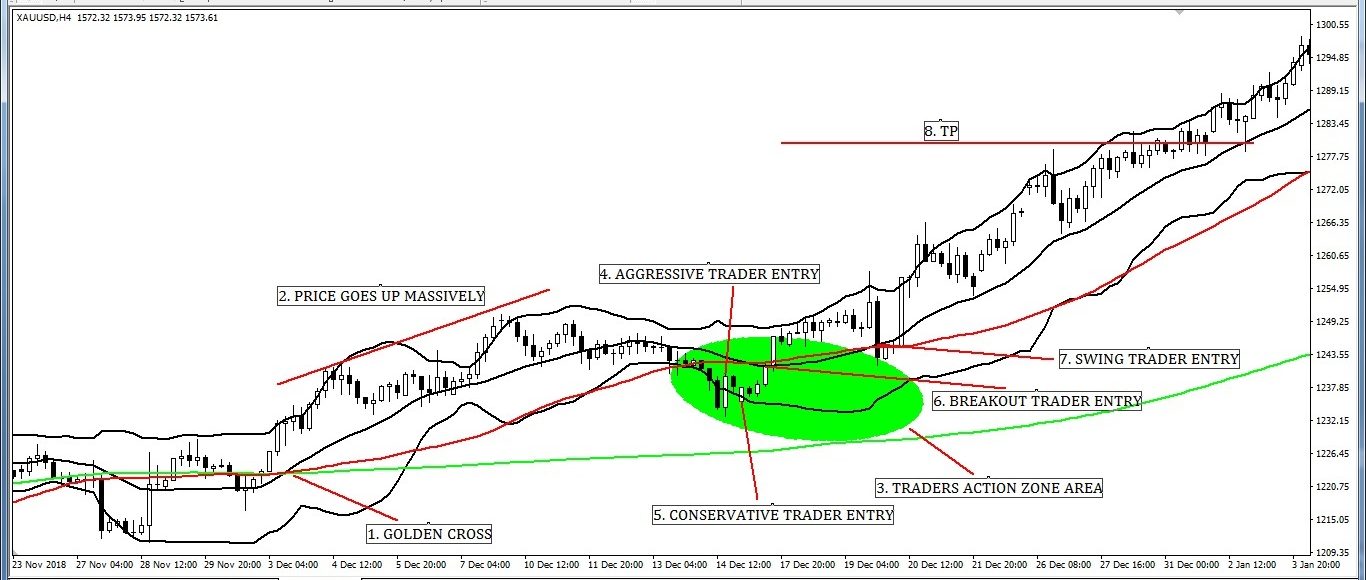
Image: Traders Action Zone (TAZ) Entry and Exit Strategy with Bollinger Band.
Image point number – 1, We see candlesticks close above 200 Moving Average which means its uptrend. Its time to wait and watch as per Traders Action Zone (TAZ) Entry and Exit Strategy.
Image point number – 2, After Golden Cross price up massively but as per Traders Action Zone (TAZ) Entry and Exit Strategy we have to wait until the price comes back Traders Action Zone (TAZ).
Image point number – 3, At last price come back in Traders Action Zone (TAZ) thus its time to Look for bullish price action reversal candlesticks pattern (PIN BAR, BULLISH ENGULFING, MORNING STAR, HAMMER, HARAMI, PIERCING, DOJI, etc.)
Image point number – 4, Aggressive trader put their BUY STOP order two to five pips above of reversal candlesticks.
After hitting BUY STOP order, Aggressive trader place STOP LOSS two to five pips below of reversal candlesticks.
Image point number – 5, Bollinger Band user Conservative trader put their BUY LIMIT order with Bollinger Lower Band.
After hit BUY LIMIT order Conservative trader place STOP LOSS two to five pips below of 200 Simple Moving Average.
Image point number – 6, Bollinger Band user Breakout trader put their BUY STOP order Bollinger Middle Band breakout candlesticks.
After hitting BUY STOP order, Breakout trader place STOP LOSS two to five pips below of 200 Simple Moving Average or Bollinger Lower Band which different less.
Image point number – 7, Bollinger Band user Swing trader put their BUY LIMIT order with Bollinger Middle Band.
After hit BUY LIMIT order Swing trader place STOP LOSS two to five pips below of 200 Simple Moving Average or Bollinger Lower Band which different less.
Image point number – 8, Near Swing High or 1: 2 or 1 : 3 risk-reward ratio, Conservative or aggressive trader place TP.
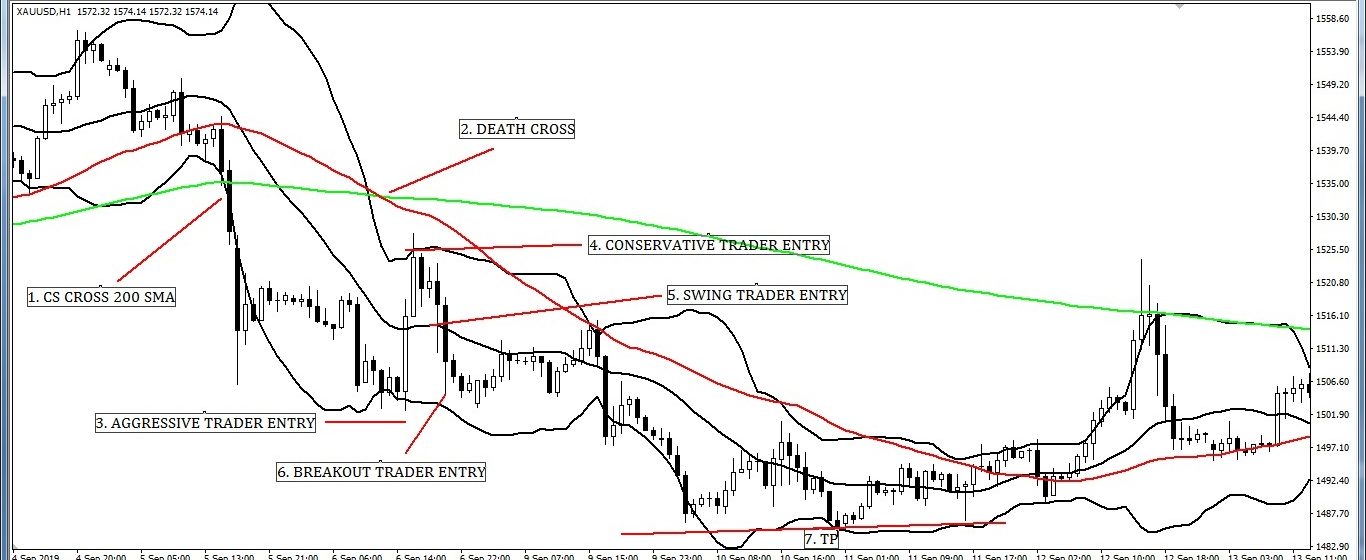
Image: Various Entry and Exit Strategy when Death Cross with Bollinger Band.
Image point number – 1, We see candlesticks close below 200 Moving Average which means its downtrend. Its time to wait and watch as per various Entry and Exit Strategy when Death Cross with Bollinger Band.
Image point number – 2, Maintaining sideways below 200 Simple Moving Average where candlesticks never close above 200 Simple Moving Average and never close above Bollinger Upper Band. Price is till now bearish and we have to wait for Death Cross.
At last Death Cross created and we hope that price will go down massively.
Image point number – 3, Aggressive trader put their SELL STOP order two to five pips below of Death Crossing candlesticks.
After hitting BUY STOP order, Aggressive trader place STOP LOSS 2 pips above of 50 Simple Moving Average.
Image point number – 4, Bollinger Band user Conservative trader put their SELL LIMIT order with Bollinger Upper Band.
After hit SELL LIMIT order Conservative trader place STOP LOSS two to five pips above 50 Simple Moving Average.
Image point number – 5, Bollinger Band user Swing trader put their SELL LIMIT order with Bollinger Middle Band.
After hit the SELL LIMIT order swing trader place STOP LOSS two to five pips above 50 Simple Moving Average or Bollinger Upper Band which different more.
Image point number – 6, Bollinger Band user Breakout trader put their SELL STOP order Bollinger Lower Band breakout candlesticks.
After hitting the SELL STOP order, Breakout trader place STOP LOSS two to five pips above 50 Simple Moving Average or Bollinger Upper Band which different more.
Image point number – 7, Near Swing Low or 1: 2 or 1 : 3 risk-reward ratio, Conservative or aggressive trader place TP.
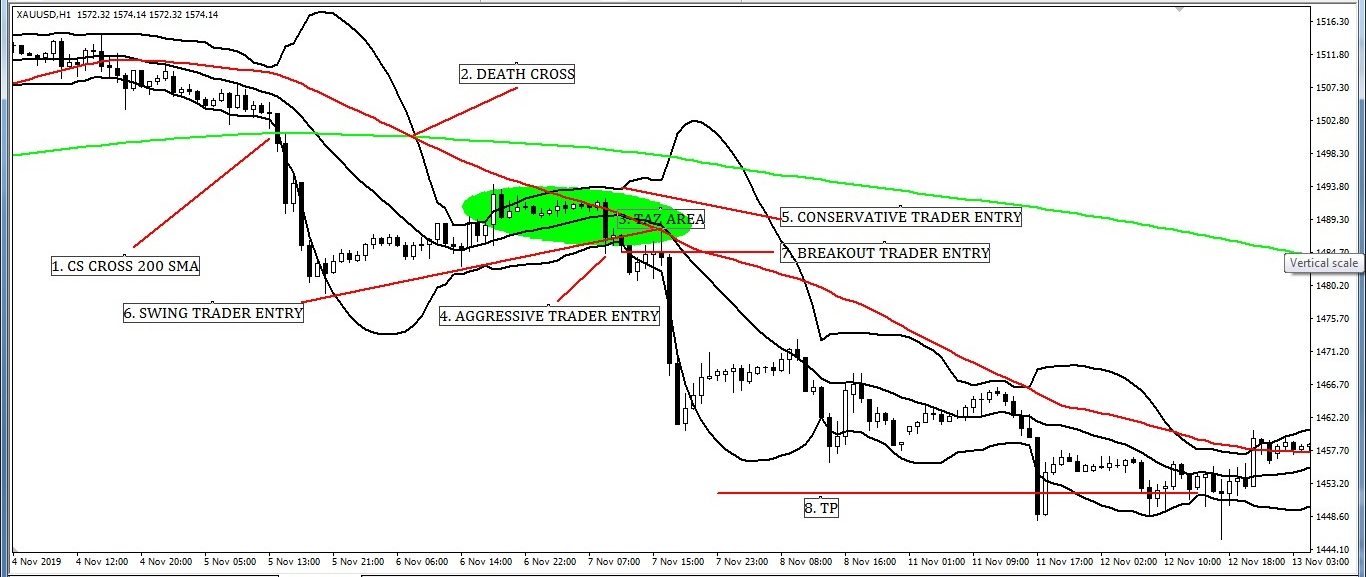
Image: Traders Action Zone (TAZ) Entry and Exit Strategy with Bollinger Band.
Image point number – 1, We see candlesticks close below 200 Moving Average which means its downtrend. Its time to wait and watch as per Traders Action Zone (TAZ) Entry and Exit Strategy.
Image point number – 2, After Death Cross price is sideways but as per Traders Action Zone (TAZ) Entry and Exit Strategy we have to wait until price comes back Traders Action Zone (TAZ).
Image point number – 3, At last price come back in Traders Action Zone (TAZ) thus its time to Look for bearish price action reversal candlesticks pattern (PIN BAR, BEARISH ENGULFING, SHOOTING STAR, HARAMI, DARK CLOUD COVER, DOJI, etc.)
Image point number – 4, Aggressive trader put their SELL STOP order 2 pips below of Death Crossing candlesticks.
After hitting BUY STOP order, Aggressive trader place STOP LOSS 2 pips above of 50 Simple Moving Average.
Image point number – 5, Bollinger Band user Conservative trader put their SELL LIMIT order with Bollinger Upper Band.
After hit SELL LIMIT order Conservative trader place STOP LOSS two to five pips above 50 Simple Moving Average.
Image point number – 6, Bollinger Band user Swing trader put their SELL LIMIT order with Bollinger Middle Band.
After hit the SELL LIMIT order swing trader place STOP LOSS two to five pips above 50 Simple Moving Average or Bollinger Upper Band which different more.
Image point number – 7, Bollinger Band user Breakout trader put their SELL STOP order Bollinger Lower Band breakout candlesticks.
After hitting the SELL STOP order, Breakout trader place STOP LOSS two to five pips above 50 Simple Moving Average or Bollinger Upper Band which different more.
Image point number – 8, Near Swing Low or 1: 2 or 1 : 3 risk-reward ratio, Conservative or aggressive trader place TP.
Bollinger Band Strategies (Part-10):
Here we have discussed Double Golden Cross with Bollinger Band Entry-Exit Strategy. Also Double Death Cross with Bollinger Band Entry-Exit Strategy.
The below link is for your ready reference for details.
Bollinger Band Strategies (Part-10):
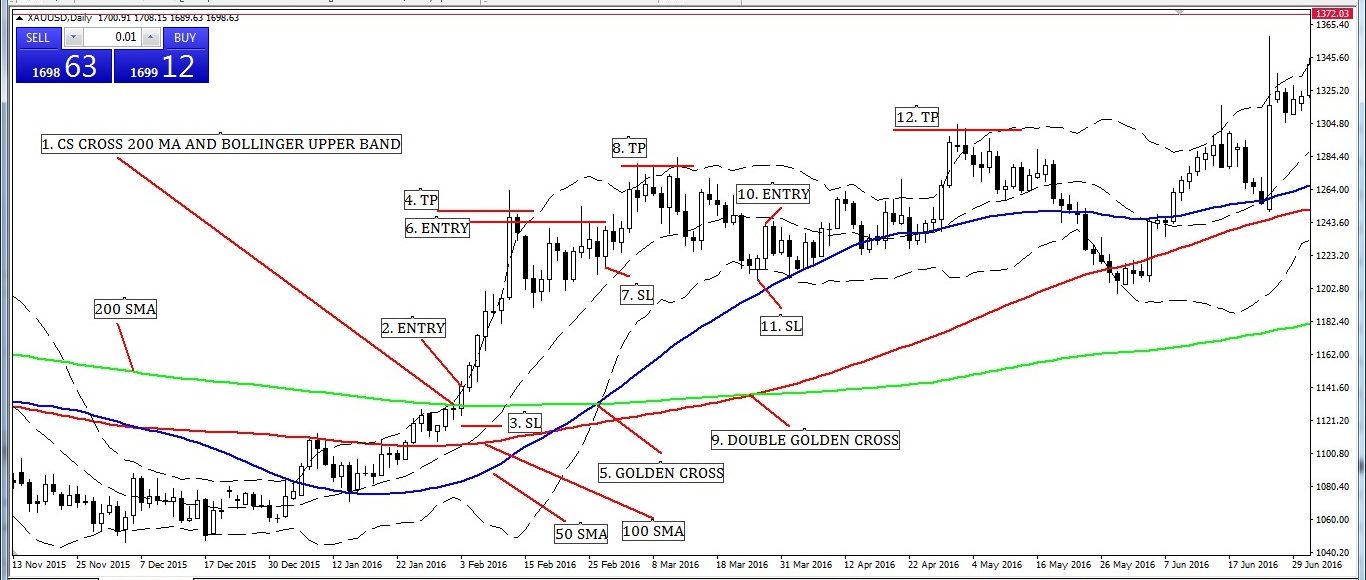
Image point number – 1, Candlesticks close above 200 Moving Average with breakout Bollinger Upper Band which confirmed that its uptrend.
Image point number – 2, Though this strategy is a combo strategy with Bollinger band and double golden cross. Now its time take entry as an aggressive trader. Here one thing is most important that if you are conservative or pull back trader, obviously you will avoid this entry. Because discipline is key elements for success in forex. So we must be disciplined as on our trading style.
Put BUY STOP order two to five pips above by aggressive trader on 200 Moving Average and Bollinger Upper Band breakout candlesticks.
Image point number – 3, Hit BUY STOP order STOP LOSS place two to five pips below of entry CS by the aggressive trader.
Image point number – 4, Near swing high or 1: 2 or 1 : 3 risk-reward ratio as per own choice.
Image point number – 5, Wow TP hit so its celebrating time also time to watch when golden cross happened.
At last golden crossed created.
Image point number – 6, After golden crossed put BUY STOP order two to five pips above by aggressive or conservative trader on golden crossed candlesticks.
Image point number – 7, After hitting BUY STOP order, STOP LOSS place two to five pips below of entry CS by the aggressive or conservative trader.
Image point number – 8, Near swing high or 1:2 or 1 : 3 risk-reward ratio as per own choice.
Image point number – 9, Wow again TP hit again so celebrating time again. Because of the continuing process through this strategy thus we have no time to leisure. Now we have to watch when the double golden cross happened.
Hurrah double golden crossed created.
Image point number – 10, After double golden crossed put BUY STOP order two to five pips above by aggressive or conservative trader on golden crossed candlesticks.
Image point number – 11, Hit BUY STOP order STOP LOSS place two to five pips below of entry CS by the aggressive or conservative trader.
Image point number – 12, Near swing high or 1:2 or 1 : 3 risk-reward ratio as per own choice.

Image: Traders Action Zone (TAZ) Entry and Exit Strategy.
Image point number – 1, Candlesticks close above 200 Moving Average which identifies its uptrend. Now time to watch movie or reading book till getting a valid signal as per Traders Action Zone (TAZ) Entry and Exit Strategy.
After Golden Cross price goes up but as per Traders Action Zone (TAZ) Entry and Exit Strategy, we have to continue watching a movie or reading a book until the price comes back Traders Action Zone (TAZ).
Image point number – 2, Also after Double Golden Cross price massively goes up. But as per Traders Action Zone (TAZ) Entry and Exit Strategy, We have to continue watching a movie or reading a book until the price comes back Traders Action Zone (TAZ).
Image point number – 3, Price come back in Traders Action Zone (TAZ). So stop watching movie or reading book because it’s trading time. Time to concentrate market. And find bullish price action reversal candlesticks pattern (PIN BAR, BULLISH ENGULFING, MORNING STAR, HAMMER, HARAMI, PIERCING, DOJI, etc.)
After finding bullish price action reversal candlesticks pattern put BUY STOP order two to five pips above by aggressive or conservative trader on that candlesticks.
Image point number – 4, Hit BUY STOP order STOP LOSS place two to five pips below of entry CS by an aggressive or conservative trader.
Image point number – 5, Near swing high or 1:2 or 1 : 3 risk-reward as per own choice.
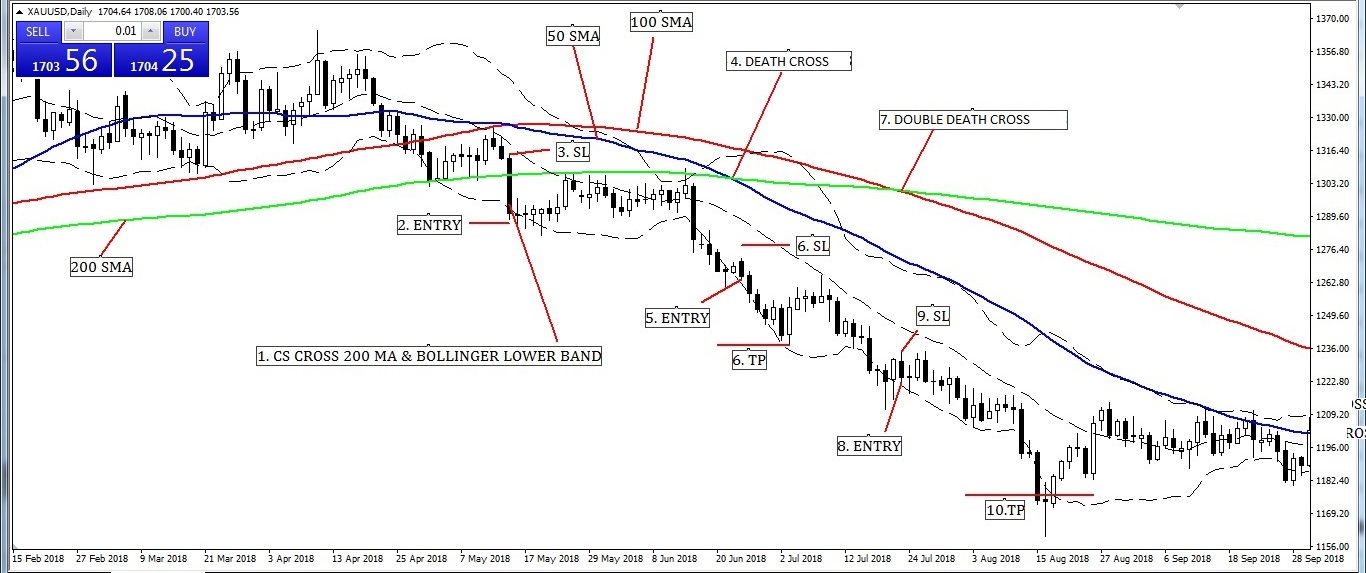
Image: Aggressive Entry and Exit Strategy when Bollinger Lower Band Cross, Death Cross, and Double Death Cross.
Image point number – 1, Candlesticks close below 200 Moving Average. Also its breakout Bollinger Lower Band which means its downtrend confirmed.
Image point number – 2, Though this strategy is a combo strategy with Bollinger band and double golden cross. Now its time take entry as an aggressive trader. Here one thing is most important. That is if you are conservative or pull back trader, obviously you will avoid this entry. Because discipline is the key element for success in forex. So we must be disciplined as on our trading style.
Put SELL STOP order two to five pips below by aggressive trader on 200 Moving Average and Bollinger Lower Band breakout candlesticks.
Image point number – 3, Hit SELL STOP order STOP LOSS place two to five pips above of entry CS by an aggressive trader.
Image point number – 4, Near swing low or 1: 2 or 1 : 3 risk-reward ratio as per own choice.
Image point number – 5, Wow TP hit. So its celebrating time. Also time to watch when death crosses happened.
At last, death crossed created.
Image point number – 6, After death crossed put SELL STOP order two to five pips below by an aggressive or conservative trader on death crossed candlesticks.
Image point number – 7, Hit SELL STOP order STOP LOSS place two to five pips above of entry CS by the aggressive or conservative trader.
Image point number – 8, Near swing low or 1:2 or 1 : 3 risk-reward ratio place by as per own choice.
Image point number – 9, Wow again TP hit. So its celebrating time again. Because of the continuing process through this strategy, we have no time for leisure. Now we have to watch when a double death cross happened.
Hurrah double death crossed created.
Image point number – 10, After double golden crossed put SELL STOP order two to five pips below by an aggressive or conservative trader on death crossed candlesticks.
Image point number – 11, Hit SELL STOP order STOP LOSS place two to five pips above of entry CS by the aggressive or conservative trader.
Image point number – 12, Near swing low or 1:2 or 1 : 3 risk-reward ratio as per own choice.
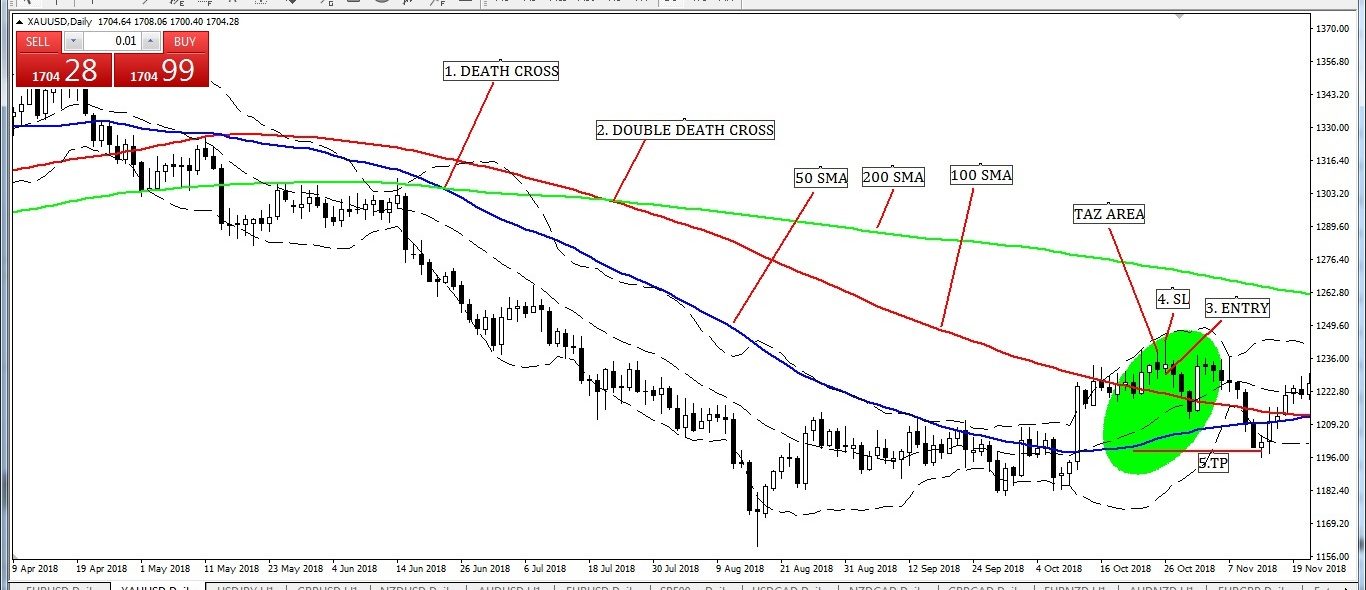
Image: Traders Action Zone (TAZ) Entry and Exit Strategy.
Image point number – 1, Candlesticks close below 200 Moving Average. It identifies downtrend. Now time to watch movie or reading books. Also wait till getting a valid signal as per Traders Action Zone (TAZ) Entry and Exit Strategy.
After Death Cross price massively goes down. But as per Traders Action Zone (TAZ) Entry and Exit Strategy, we have to continue watching a movie or reading a book. And wait for the price comes back to Traders Action Zone (TAZ).
Image point number – 2, Also after Double Death Cross price massively goes down. But as per Traders Action Zone (TAZ) Entry and Exit Strategy, We have to continue watching a movie or reading a book. Ans wait for the price comes back Traders Action Zone (TAZ).
Image point number – 3, Price come back in Traders Action Zone (TAZ). So stop watching movie or reading book because It’s trading time. Time to concentrate market. Try to find bearish price action reversal candlesticks pattern (PIN BAR, BEARISH ENGULFING, SHOOTING STAR, HARAMI, DARK CLOUD COVER, DOJI, etc.)
After finding bearish price action reversal candlesticks pattern, thereafter put SELL STOP order two to five pips below by an aggressive or conservative trader on that candlesticks.
Image point number – 4, Hit SELL STOP order STOP LOSS place two to five pips above of entry CS by the aggressive or conservative trader.
Image point number – 5, Near swing low or 1:2 or 1 : 3 risk-reward ratio as per own choice.
SPECIAL NOTES:
WAOO….. IT’S NEAR NINE THOUSAND CONTENT ARTICLE. WE SURE IT WILL TAKE YOUR VALUABLE TIME. BUT KEEP PATIENCE.
REMEMBER ONE IMPORTANT THING, TODAY HARD WORKING WILL CREATE YOU A CONSISTENTLY PROFITABLE FOREX, STOCK, COMMODITY AND OPTION TRADER.
THERE IS NO SHORTCUT. WHEN YOU TRY TO KNOW ABOUT SUCCESSFUL FOREX, STOCK, COMMODITY, AND OPTION TRADER IN THE WORLD. YOU MUST FIND ONE SIMILARITY OF ALL. AND THIS SIMILARITY IS HARD WORKING AND DESIRE TO BE SUCCESSFUL.
Suggestions:
Below special suggestion from the earnmoneyfx.com team…….
If you are a beginner trader, then try to adopt one or two strategies from here.
If you are an advanced trader, then try to adopt one by one strategy from here.
If you are an expert trader, then try to adopt all strategies from here.
Thanks for giving us your most valuable time. Also, keep touch earnmoneyfx.com.
Leave your valuable comment on the comment box which will help us to the published new strategy.
~~~~~~~~~~~~~~~~~~~~ THANKS ~~~~~~~~~~~~~~~~~~~~~


