 Earn Money Forex Best Forex Trading Experience

Bollinger Band Strategies (Part-5)
Friends……. Thanks a lot for visiting earnmoneyfx.com
earnmoneyfx.com research team suggest Bollinger Band Entry-Exit strategies as below,
- Candlesticks Pattern with Bollinger Band
- Double Top Chart Pattern with Bollinger Band
- Double Bottom Chart Pattern with Bollinger Band
- Reversal or Counter Candlesticks with Bollinger Band
- Trend line Breakout with Bollinger Band
- Swing Trading with Middle Band (20 Simple Moving Average) Bollinger Band
- 200 Simple Moving Average with Bollinger Band
- Walking with Bollinger Band etc.
Bollinger Brand Entry-Exit Strategy (Part -1) we have discussed Candlesticks Pattern with Bollinger Band and Double Top Chart Pattern with Bollinger Band.
Bollinger Brand Entry-Exit Strategy (Part -2) we have discussed Double Bottom Chart Pattern with Bollinger Brand and Reversal or Counter Candlesticks with Bollinger Band.
Bollinger Band Entry-Exit Strategy (Part -3) we have discussed Trend line Breakout with Bollinger Band.
Bollinger Brand Entry-Exit Strategy (Part -4) we have discussed Swing Trading with Middle Band (20 Simple Moving Average) Bollinger Band.
If you missed all or anyone, Earnest request you to visit Bollinger Brand Entry-Exit Strategy (Part -1), Bollinger Band Entry-Exit Strategy (Part -2), Bollinger Band Entry-Exit Strategy (Part -3), and Bollinger Band Entry-Exit Strategy (Part -4) in earnmoneyfx.com
This article earnmoneyfx.com research teams try to cover another strategy as below.
*** 200 Simple Moving Average with Bollinger Band ***
Let’s explore ……….
200 Simple Moving Average with Bollinger Band:
Before exploring 200 Simple Moving Average with Bollinger Band at first we learn to know what is Simple Moving Average and why 200 Simple Moving Average.
What is a Simple Moving Average?
Moving Average is various types. E.g. Simple Moving Average (SMA), Exponential Moving Average (EMA), Smoothed Moving Average (SMMA), etc.
Simple Moving Average (SMA) is the most used of them because its easy to calculate and understand.
Definition and Calculation of Simple Moving Average (SMA):
A simple moving average is formed by calculating the average price of a currency over a specific number of periods.
Most moving averages are based on closing prices; for example, a 5-day simple moving average is the five-day sum of closing prices divided by five.
As its name implies, a moving average is an average that moves.
Old data is dropped as new data becomes available, causing the average to move along the time scale.
The example below shows a 5-day moving average evolving over three days.
- Daily Closing Prices: 11,12,13,14,15,16,17
- First day of 5-day SMA: (11 + 12 + 13 + 14 + 15) / 5 = 13
- Second day of 5-day SMA: (12 + 13 + 14 + 15 + 16) / 5 = 14
- Third day of 5-day SMA: (13 + 14 + 15 + 16 + 17) / 5 = 15
The first day of the moving average simply covers the last five days.
The second day of the moving average drops the first data point (11) and adds the new data point (16).
The third day of the moving average continues by dropping the first data point (12) and adding the new data point (17).
In the example above, prices
es gradually increases from 11 to 17 over a total of seven days.
Notice that the moving average also rises from 13 to 15 over a three-day calculation period.
Also, notice that each moving average value is just below the last price. For example, the moving average for day one equals 13 and the last price is 15. Prices the prior four days were lower and this causes the moving average to lag.
For your kind information, Any moving average strategy is a trend trading system.
Moving Average works well when the price is up to trend or downtrend.
In a choppy or sideways market moving average strategies are unable to well.
So we always avoid using moving average strategies when markets are choppy or sideways.
Otherwise, it’s chance to hit stop loss more and more.
Simple Moving Average is the default indicator in Metatrader4 or Metatrader5.
Metatrader4 Simple Moving Average plot as below
Open Metatrader4 > Insert > Indicator > Trend > Moving Average> Simple > OK
Why 200 Simple Moving Average?
200 Moving Average is one of the most popular indicators. It’s also called an institutional indicator because most of the institutes use it for long-term analysis.
Generally its use for identifying a trend.
Converse between traders as like as below,
EURUSD close below daily 200 moving average. It’s a downtrend. It will go down!
NZDUSD close above daily 200 moving average. It’s an uptrend. It will go up!
Daily & Weekly 200 moving average use for long-term trend identification.
Four Hour (h4) 200 moving average use for midterm trend identification.
One Hour (h1) 200 moving average use for short-term trend identification.
These strategies we enter buy trade when the price is above 200 Simple Moving Average.
Also, we enter the sale trade when the price is below the 200 Simple Moving Average.
Let’s know how to plot 200 Moving Average on Metarader4
Open Metatrader4 > Insert > Indicator > Trend > Moving Average > Period: 200 >
Shift: 0 > MA Method: Simple > Apply to: Close > OK

200 Simple Moving Averages Re-test with Bollinger Band Entry-Exit Strategy
Image point number – 1, Candlesticks breakout 200 Simple Moving Averages and Bollinger Upper Band. As per the strategy, This time we have nothing to do. We have to wait for 200 Simple Moving Averages retest.
Image point number – 2, Candlesticks retest 200 Simple Moving Averages. Now we have to wait for reversal candlesticks to entry.
Image point number – 3, Aggressive or conservative trader put their BUY STOP order 2 pips above of this reversal candlestick.
Image point number – 4, After hitting BUY STOP order aggressive trader place STOP LOSS 2 pips below of reversal candlestick. Conservative trader place STOP LOSS 2 pips below of swing low.
Image point number – 5, Conservative or aggressive trader place their take profit level on the near swing high or 1: 2 or 1 : 3 risk-reward ratio.
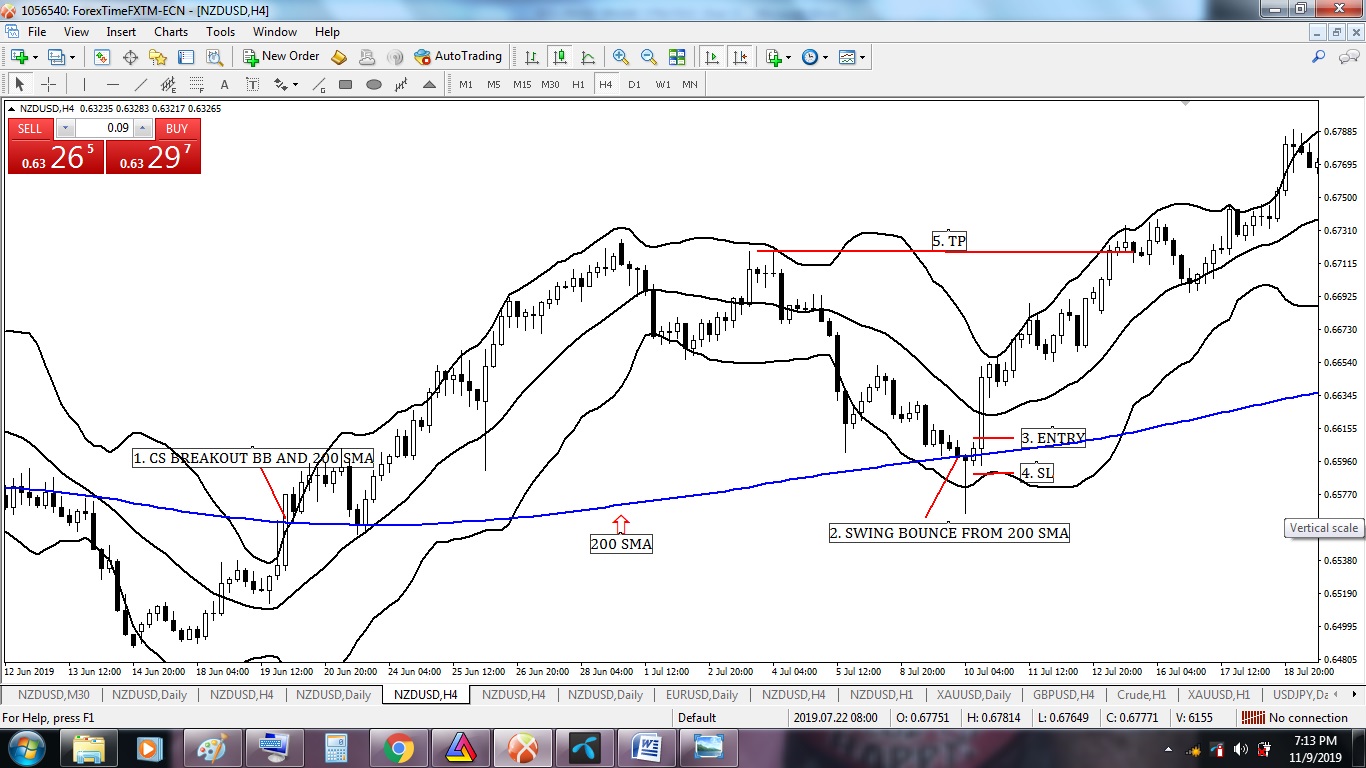
Image 2: 200 Simple Moving Averages swing with Bollinger Band Entry-Exit Strategy
Image point number – 1, Candlesticks breakout 200 Simple Moving Averages and Bollinger Upper Band. As per the strategy, This time we have nothing to do. We have to wait for 200 Simple Moving Averages retest. 200 Simple Moving Averages retest/pullback trader already entry and exit when retest completed.
As a 200 Simple Moving Averages swing with Bollinger Brand, We have to wait for price swing from 200 Simple Moving Averages.
Image point number – 2, Candlesticks come back 200 Simple Moving Averages as swing. Now we have to wait for reversal candlesticks to entry.
Image point number – 3, Aggressive or conservative trader put their BUY STOP order 2 pips above of this reversal candlestick.
Please note, Longtail pin bar is the most profitable and highly successful reversal candlestick. But we do not entry this pin bar candlesticks because it’s close below 200 Simple Moving Average. Thus we wait for the next candlesticks and if it closes above 200 Simple Moving Average, we will entry.
Image point number – 4, After hit BUY STOP order aggressive trader place STOP LOSS 2 pips below of reversal candlestick. Conservative traders place STOP LOSS 2 pips below or swing low.
Image point number – 5, Conservative or aggressive trader place their take profit level on the near swing high or 1: 2 or 1 : 3 risk-reward ratio.
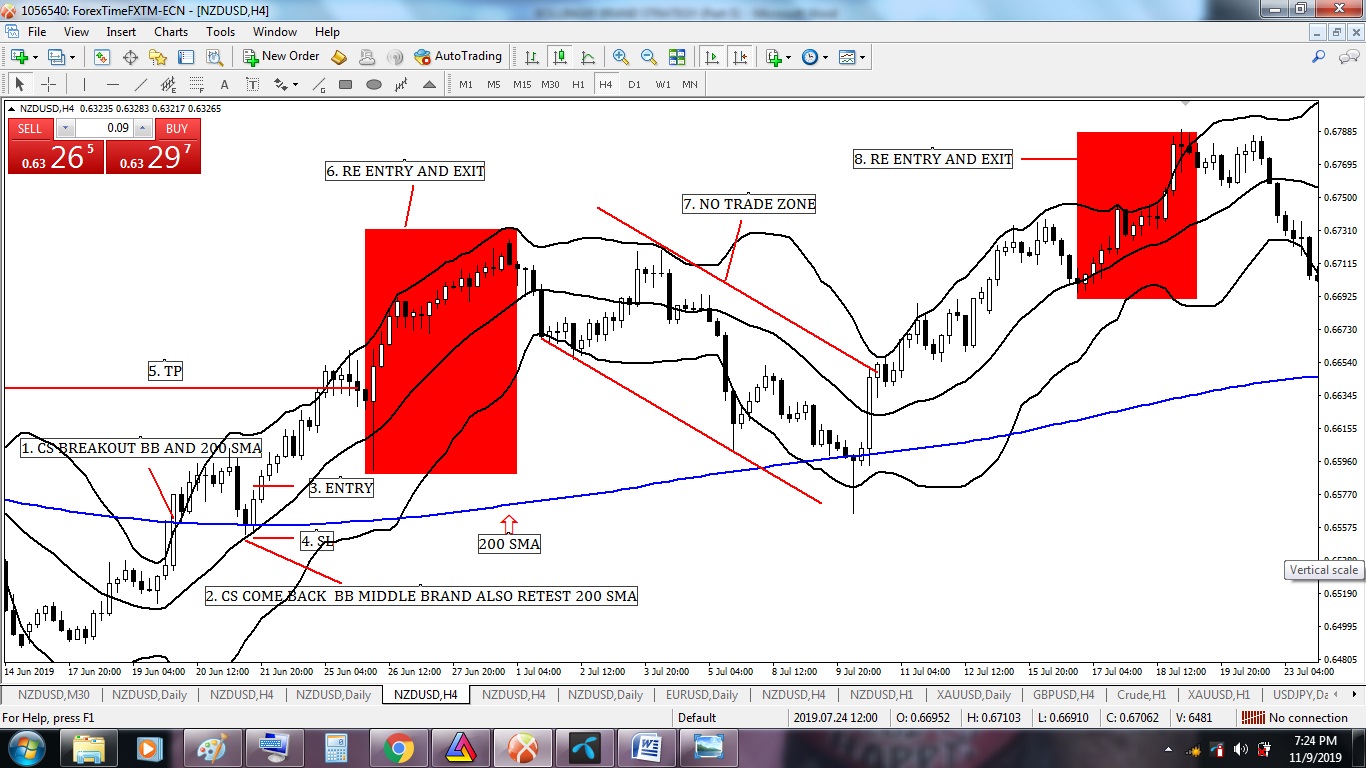
200 Simple Moving Averages with Bollinger Middle Band Swing Entry-Exit Strategy
Image point number – 1, Candlesticks breakout 200 Simple Moving Averages and Bollinger Middle Band. As per the strategy, This time we have nothing to do. We have to wait for candlesticks to come back Bollinger Middle Band and 200 Simple Moving Averages retest.
For your kind information, 200 Simple Moving Averages retest is not mandatory for this strategy
Image point number – 2, Candlesticks come back Bollinger Middle Brand and retest 200 Simple Moving Averages. Its confluence gives us extra confidence to entry. Now we have to wait for reversal candlesticks to entry.
Image point number – 3, Aggressive or conservative trader put their BUY STOP order 2 pips above of this reversal candlestick.
Image point number – 4, After hit BUY STOP order aggressive trader place STOP LOSS 2 pips below of reversal candlestick. Conservative traders place STOP LOSS 2 pips below or swing low.
Image point number – 5, Conservative or aggressive trader place their take profit level on the near swing high or 1: 2 or 1 : 3 risk-reward ratio.
Image point number – 6, Re-entry, and exit scope.
Image point number – 7, NO TRADE ZONE. As per 200 Moving Average rules we never sell above 200 Moving Average.
Image point number – 8, Another re-entry and exit scope.
——- Thanks for giving your valuable time to read this article ——–


