Friends…….
It’s our great pleasure to visit earnmoneyfx.com, Thanks
earnmoneyfx.com research team always try to provide you with authentic and profitable
strategy.
Please note, earnmoneyfx.com research team always provides those strategies which
the success rate is above 70 percent.
As as previous, we discover our new strategy Triangle Pattern with Alligator
Indicator Confluence Strategy.
For your kind information, Triangle Pattern with Alligator Indicator Confluence
Strategy (Part-1), we just discuss what a Triangle pattern is and How to identify
Ascending Triangle pattern, Descending Triangle pattern, and Symmetrical Triangle
pattern?
Also discuss what is Alligator Indicator and the formula of Alligator Indicator, What is
confluence Technique?
Let’s Explore……………
Before exploring Triangle with Alligator Confluence Strategy, We must have an idea about
Triangle Pattern, Alligator Indicator, and Confluence technique.
Demo test as per earnmonreyfx.com research team, any timeframe and any pair this
the strategy works well.
One Hourly, Four Hourly, Daily timeframe and EURUSD, GBPUSD, AUDUSD, NZDUSD,
USDCHF, USDCAD, USDJPY, EURJPY, GBPJPY, XAUUSD, XAUEUR, CRUDE OIL and
S&P500 is best.
Chart Pattern is one of the most favorite tools in forex, stock, commodities, and other
financial market to identify buy and sell position.
Worldwide traders use chart patterns vastly. Thus when you identify any chart pattern as
accurately in the financial market then you may be sure that you with market direction.
There are many types of chart patterns repeated in forex, stock, commodities, and another financial market. E.g Double Top pattern, Double Bottom pattern, Triple Top pattern,
Triple Bottom pattern, Head and Shoulder pattern, Inverse Head and Shoulder pattern,
Rising Wedge pattern, Falling Wedge pattern, Up Channel, Bottom Channel, Pennant pattern,
Flag pattern and Triangle pattern etc.
There are three types of Triangle patterns.
1. Ascending Triangle Pattern.
2. Descending Triangle Pattern.
3. Symmetrical Triangle Pattern.
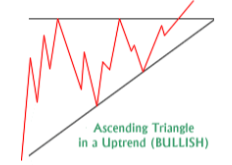
Ascending Triangle Pattern: When Ascending triangles create an uptrend, then it’s secure
most reliable. Thus its call a bullish formation pattern
Being flat of the top part of the ascending triangle is one of the major conditions.
Also, several times Higher Low creates are another condition of ascending triangle.

As the above image of the Ascending Triangle Pattern, we found below things.
With an overbought situation, Price created a higher high position.
Thereafter price goes to correction and try to turn back.
Again try to touch the previous high a few times later.
Thereafter price goes to correction and try to turn back.
At last, Breakout was created successfully with a new high which means BULLS are king
now.
The minimum requirement of the ascending triangle is bullish is two flat-top touches and
two higher low.
Descending Triangle Pattern: When descending triangles create in a downtrend, then it’s
secure most reliable. Thus its call a bearish formation pattern
Being flat in the lower part of the descending triangle is one of the major conditions.
Also, several times Lower High creates are another condition of the descending triangle.

As the above image of the Descending Triangle Pattern, we found below things.
With oversold situations, Price created a lower low position.
Thereafter price going to reverse and try to turn back.
Again try to touch the previous low a few times later.
Thereafter price going to reverse and try to turn back.
At last, Breakout was created successfully with a new low which means BEARS are king
now.
The minimum requirement of descending triangle in bearish is two flat low touch
and two lower high.
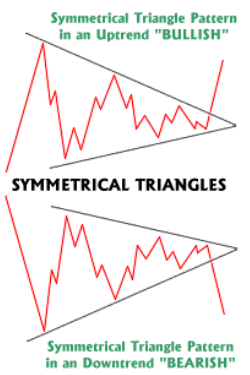
Symmetrical Triangle Pattern: Demand and Supply are equal with the area of indecision
where the present price is a pause and future direction is questionable. This time Symmetrical
Triangle pattern created.

What is Alligator Indicator?
In 1995, Bill Williams was introducing a first-time Alligator Indicator.
As called the jaw, the teeth and the lips are Alligator three lines.
Find out trending or sideways, Traders try to identify by Alligator Indicator.
With chart pattern or momentum indicator, the Alligator indicator helps to determine is market
now corrective or impulsive.
As like as Alligator, Alligator indicator situated in two-position………
1. Sleeping position.
2. Wake up position.
In the sleeping position, the Alligator mouth is closed which means candlesticks are in the same range or
sideways position. That’s time no direction in the market. But one thing is for future that,
The market will run up or down heavily as long as the time Alligator sleep.
In the wake-up position, Alligator’s mouth is open which means candlesticks are creating higher
high or lower low. That’s a time-specific direction in the market. But one thing we have to note
that, Market, will run up or down heavily as long as the time Alligator sleep previously.
Alligator Indicator Formula:
The Alligator indicator is common on Metatrader4 trading software and the calculation
formula sequence involves these straightforward steps:
1) The Alligator’s Jaw, the “Blue” line, is a 13-period Smoothed Moving Average, moved
into the future by 8 bars;
2) The Alligator’s Teeth, the “Red” line, is an 8-period Smoothed Moving Average, moved
by 5 bars into the future;
3) The Alligator’s Lips, the “Green” line, is a 5-period Smoothed Moving Average, moved
by 3 bars into the future.
Confluence Technique:
Confluence technique means when one more indicator or indicator and chart pattern give
buy or sell signals at a time or same zone of price.
Confluence trading is the most reliable trading.
Traders try to find out confluence in a chart when buy or sell because it ensures eighty to
ninety percent right decision.
Chart pattern, Indicator, and Fibonacci or Pivot point Confluence shown more and more
accurate.
So last not least,
Triangle pattern with Alligator Indicator Confluence Entry-Exit Strategy (Part-2), we
will discuss the below strategy elaborately with chart and details,
1. Ascending Triangle pattern with Alligator indicator Confluence Entry-Exit
Strategy (BUY),
2. Descending Triangle pattern with Alligator indicator Confluence Entry-Exit
Strategy (SELL),
3. Symmetrical Triangle pattern with Alligator indicator Confluence Entry-Exit
Strategy (BUY),
4. Symmetrical Triangle pattern with Alligator indicator Confluence Entry-Exit
Strategy (SELL).
we can use for trading 200 moving strategy
——- Thanks for giving your valuable time to read this article ——–
(To be continued)
 Earn Money Forex Best Forex Trading Experience


