 Earn Money Forex Best Forex Trading Experience


200 Moving Average Strategies (Part-1)
Before explore 200 Moving Average Strategies (Part-1), Firstly we have to know what is 200 MA. Actually, it is moving an average curve of 200 candlesticks. There are various 200 ma candlesticks types. E.g.: Weekly, Daily, Four hourly (H4), Hourly H1, etc. If you place Daily 200 MA in the chart that means it shown 200 days moving average. As like as same in weekly, h4, h1, etc.
Moving Average are various types. E.g. Simple Moving Average (SMA), Exponential Moving Average (EMA), Smoothed Moving Average (SMMA), etc.
200 Moving Average Straretigies use mostly in Simple SMA & EMA
200 Moving Average is one of the most popular indicators. It’s also called an institutional indicator because most of the institutes use it for long term analysis.
Generally its use for identifying a trend. Trader converse EURUSD close below daily 200 moving average. It’s a downtrend. It will go down!
Also, NZDUSD close above the daily 200 moving average. It’s an uptrend. It will go up!
Daily & Weekly 200 moving average use for long term trend identification.
Four Hour (h4) 200 moving average use for midterm trend identification.
One Hour (h1) 200 moving average use for short term trend identification.
Also, you can use Weekly, Daily, H4, H1 combined in multi time frame 200 moving average analysis. I will discuss later how multi-timeframe analysis in 200 Moving Average.
Before explore 200 Moving Average Strategies (Part-1), We have to know various type of entry-exit strategies of Daily 200 Simple Moving Average as below:
-
Support & Resistance
-
200 MA Bounce
-
Trend line
-
Ascending Triangle
-
Descending Triangle
-
Flag Pattern
-
Channel
-
Candlesticks Pattern
-
Golden Cross
-
Death Cross
-
Short term & Mid term moving average cross
-
Multi time frame analysis.
Lets we discover above all one by one.
Let’s explore the 200 Moving Average Strategies (Part-1):
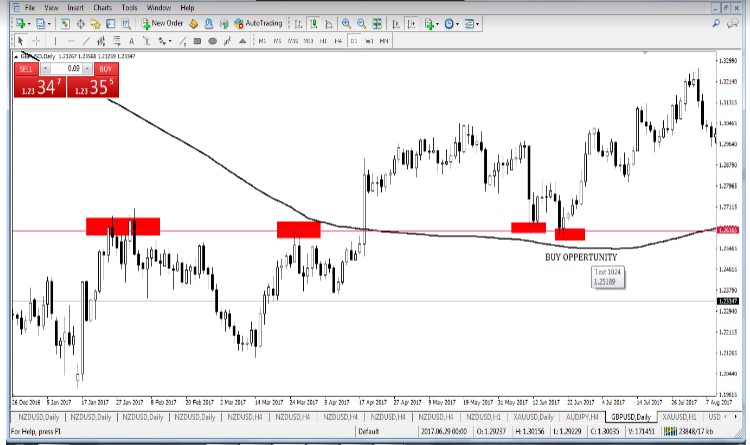
Support & Resistance:
Support & Resistance are the most uses tools in technical analysis. Firstly everybody searches for support & resistance when the open chart of any currency, commodities, metal, stocks, and index.
Support:
That’s the area of the chart where price bounces up for buying pressure. Simply two or more bounce up the area by the buyer makes support area.
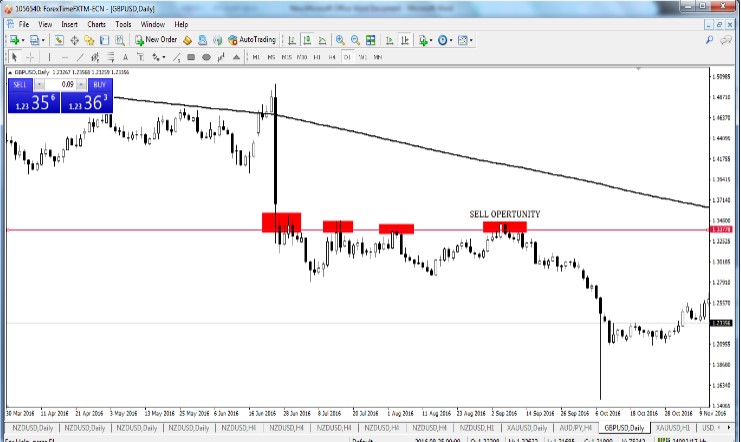
Resistance:
That’s the area of the chart where price bounces down for selling pressure. Simply two or more bounce down area by seller makes resistance area.
Entry:
So, if we find candlesticks above 200 daily moving average and price bounce up from the support area then it’s a great opportunity to BUY.
Vice versa, if we find candlesticks below 200 daily moving average and price back down from the resistance area then it’s a great opportunity to SELL.
Exit
1:2 or 1:3 Risk Reward ratio.
If you have any query about 200 Moving Average Strategies (Part-1), Don’t feel any hesitation to leave us to comment


I simply wantt to input that you have ? good website ?nd I enjoy the
design and also artcles ?n it!