 Earn Money Forex Best Forex Trading Experience

Chart pattern entry-exit strategy What is Chart Pattern?
Chart pattern is a pattern within a chart when prices are graphed. In forex,
stock, crypto, metal, and commodity trading, chart pattern studies play a huge
role during technical analysis. After plotted data, there is usually any pattern
that naturally occurs and repeats over a period. Normally chart patterns are
used as either reversal or continuation signals.
In this lesson, you will discover how to use chart patterns properly in forex,
stock, crypto, metal, and commodity markets.
Be a constable successful trader or investor, Just follow earnmoneyfx.com
provided rules properly.
Many types of chart patterns you will find in the forex, equity, commodity,
metal, crypto market. Below here, you will explore the most repeatable chart
pattern which easy to identify and trade. These are….
Double Top Chart Pattern Entry-Exit Strategy
Double Bottom Chart Pattern Entry-Exit Strategy
Head and Shoulder Chart Pattern Entry-Exit Strategy
Inverse Head and Shoulder Chart Pattern Entry-Exit Strategy
Triple Top Chart Pattern Entry-Exit Strategy
Triple Bottom Chart Pattern Entry-Exit Strategy
Symmetrical Triangle Chart Pattern Entry-Exit Strategy
Ascending Triangle Chart Pattern Entry-Exit Strategy
Descending Triangle Chart Pattern Entry-Exit Strategy
Bullish Channel Pattern Entry-Exit Strategy
Bearish Channel Pattern Entry-Exit Strategy
Bullish Flag Pattern Entry-Exit Strategy
Bearish Flag Pattern Entry-Exit Strategy
Double Top Chart Pattern Entry-Exit Strategy:
Double Top Chart Pattern:
A double top chart pattern is this pattern that traders use to highlight trend
reversals. Forex, equity, commodity, metal, crypto price will experience a
peak, before retracing back to a level of support. It will then climb up more
before reversing back more permanently against the current trend.
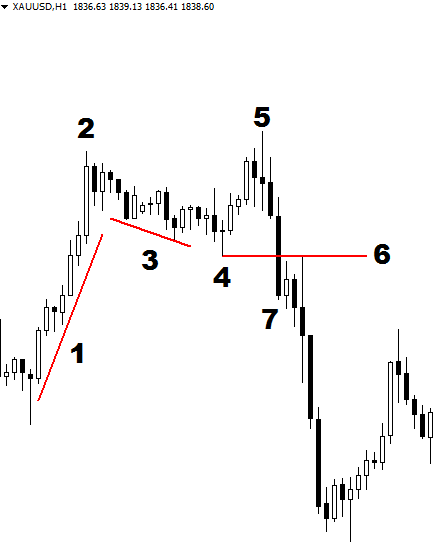
Identify the Double Top Chart Pattern:
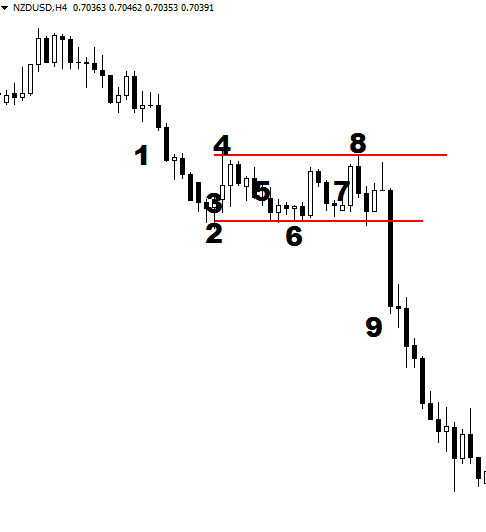
Image point number – 1, Price was full of impulsive. You have to watch
the market because any chart or candlesticks pattern will create here.
Image point number- 2, a Few times later with impulsive mode price
creates 1 st top. Sellers try to be powerful here.
Image point number- 3, Sellers beats buyers here thus price is
corrective mode now. Time to wait and observe.
Image point number – 4, After corrective mode with creating higher low
buyer, is trying to strong here. Wait for a new impulsive mood.
Image point number – 5, Price again impulsive here. As a chart
pattern trader, you have to wait and watch for any chart pattern. 2nd
top created. It’s time to wait and observe to create a double top chart
pattern.
Image point number – 6, After created 2 nd top sellers try to beat buyer
more powerfully here. A great chance to create a double-top chart pattern
here. Let’s draw a neckline.
Image point number – 7, Neckline breakdown by candlesticks with
a close below which confirm a double top pattern. It’s entry time.

Entry, Stop Loss, and Exit of Double Top Chart Pattern:
Aggressive trader put SELL STOP order two to five pips below of
neckline. After trigger trader, they place stop loss above of breakdown
candlesticks.
Conservative traders sell close prices of neckline breakdown candlesticks
with place stop loss above of neckline breakdown candlesticks.
Pullback trader put SELL limit order two pips below of neckline after
a confirmed breakdown. After trigger trader, they place stop loss above of
breakdown candlesticks.
Aggressive, Conservative, and Pullback traders place take profit level
near swing low or 1: 2 more risk-reward ratio or Double Top Chart
Pattern profit measurement as per their choice.
Double Bottom Entry-Exit Strategy:
Double Bottom Chart Pattern:
A double bottom chart pattern is a pattern that traders use to highlight trend
reversals. Forex, equity, commodity, metal, crypto price will experience a
bottom, before retracing back to a level of resistance. It will then climb up
again before reversing back more permanently against the current trend.
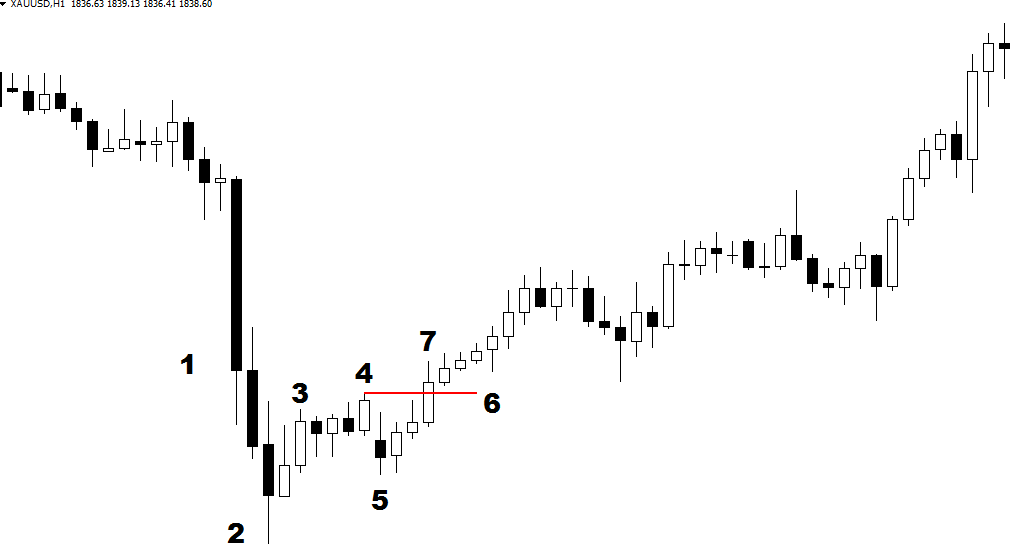
Identify the Double Bottom Chart Pattern:
Image point number – 1, Price was full of impulsive. You have to watch
the market because any chart or candlesticks pattern will create here.
Image point number- 2, Few time later with impulsive mode price
creates 1 st Bottom. Buyers try to be powerful here.
Image point number- 3, Buyers beats buyers here thus price is
reversal mode now. Time to wait and observe.
Image point number – 4, After corrective mode with creating lower High
seller, is trying to strong here. Wait for a new impulsive mood.
Image point number – 5, Price again impulsive here. As a chart
pattern trader, you have to wait and watch for any chart pattern. 2nd
bottom created. It’s time to wait and observe to create a double bottom
chart pattern.
Image point number – 6, After created 2 nd top buyers try to beat sellers
more powerfully here. A great chance to create a double bottom chart
pattern here. Let’s draw a neckline.
Image point number – 7, Neckline breakout by candlesticks with a close
below which confirms a double bottom pattern. It’s entry time.
Entry, Stop Loss, and Exit of Double Bottom Chart Pattern:
Aggressive trader put BUY STOP order two to five pips above of
neckline. After trigger trader, they place a stop loss below of breakout
candlesticks.
Conservative trader BUY close price of neckline breakdown candlesticks with placing a stop loss below of neckline breakout candlesticks.
Pullback trader put BUY limit order two pips above of neckline after
the confirmed breakout. After trigger trader, they place a stop loss below of
breakout candlesticks.
Aggressive, Conservative, and Pullback traders place take profit level
near swing high or 1: 2 more risk-reward ratio or Double Bottom Chart
Pattern profit measurement as per their choice.
Triple Top Chart Pattern Entry-Exit Strategy:
Triple Top Chart Pattern:
A triple top chart pattern is a pattern that traders use to highlight trend
reversals. Forex, equity, commodity, metal, crypto price will experience a
triple peak, before retracing back to a level of support. It will then climb up
two times before reversing back more permanently against the current trend.
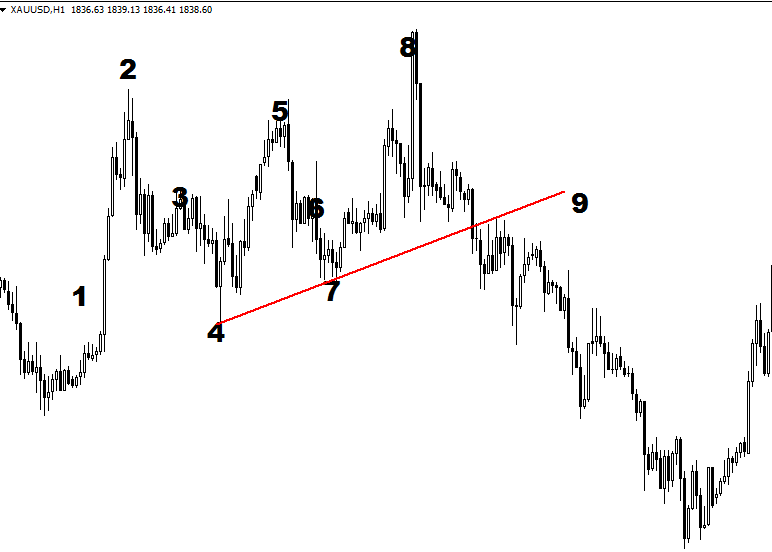
Identify the Triple Top Chart Pattern:
Image point number – 1, Price was full of impulsive. You have to watch
the market because any chart or candlesticks pattern will create here.
Image point number- 2, Few time later with impulsive mode price
creates 1 st top. Sellers try to be powerful here.
Image point number- 3, Sellers beats buyers here thus price is
corrective mode now. Time to wait and observe.
Image point number – 4, After corrective mode with creating higher low
buyer, is trying to strong here. Wait for a new impulsive mood.
Image point number – 5, Price again impulsive here. As a chart
pattern trader, you have to wait and watch for any chart pattern. 2nd
top created. It’s time to wait and observe to create a double top chart
pattern.
Image point number – 6, After created 2 nd top sellers try to beat buyer
more powerfully here. A great chance to create a double-top chart pattern
here. Let’s draw a neckline.
Image point number – 7, After corrective mode with failure to new
create higher low or breakdown 1st neckline buyer is trying to strong
here. Wait for new impulsive mood.
Image point number – 8, Price again impulsive here. As a chart pattern
trader, you have to wait and watch for any chart pattern. 3rd top
created. Its time to wait and observe to create a triple top chart pattern.
Image point number – 9, Neckline breakdown by candlesticks with
close below which confirms a triple top pattern. Its entry time.

Entry, Stop Loss, and Exit of Triple Top Chart Pattern:
Aggressive trader put SELL STOP order two to five pips below of
neckline. After trigger trader, they place stop loss above of breakdown
candlesticks.
Conservative traders sell close price of neckline breakdown candlesticks
with place stop loss above of neckline breakdown candlesticks.
Pullback trader put SELL limit order two pips below of neckline after
confirmed breakdown. After trigger trader, they place stop loss above of
breakdown candlesticks.
Aggressive, Conservative, and Pullback traders place take profit level
near swing low or 1: 2 more risk-reward ratio or Triple Top Chart
Pattern profit measurement as per their choice.
Triple Bottom Entry-Exit Strategy:
Triple Bottom Chart Pattern:
A triple bottom chart pattern is a pattern that traders use to highlight trend
reversals. Forex, equity, commodity, metal, crypto price will experience a
triple bottom, before retracing back to a level of resistance. It will then climb
up two times before reversing back more permanently against the current
trend.
Identify Triple Bottom Chart Pattern:
Image point number – 1, Price was full of impulsive. You have to watch
the market because any chart or candlesticks pattern will create here.
Image point number- 2, Few time later with impulsive mode price
creates 1 st Bottom. Buyers try to be powerful here.
Image point number- 3, Buyers beats sellers here thus price is
reversal mode now. Time to wait and observe.
Image point number – 4, After corrective mode with creating lower high
sellers, is trying to strong here. Wait for a new impulsive mood.
Image point number – 5, Price again impulsive here. As a chart
pattern trader, you have to wait and watch for any chart pattern. 2nd
top created. It’s time to wait and observe to create a double top chart
pattern.
Image point number – 6, After created 2 nd bottom buyer try to beat
sellers more powerfully here. A great chance to create a double bottom
chart pattern here. Let’s draw a neckline.
Image point number – 7, After corrective mode with failure to new
create lower high or breakout 1st neckline seller is trying to strong here.
Wait for a new impulsive mood.
Image point number – 8, Price again impulsive here. As a chart pattern
trader, you have to wait and watch for any chart pattern. 3rd bottom
created. It’s time to wait and observe to create a triple bottom chart
pattern.
Image point number – 9, Neckline breakout by candlesticks with a close
below which confirms a triple top pattern. It’s entry time.
Entry, Stop Loss, and Exit of Triple Bottom Chart Pattern:
Aggressive traders put BUY STOP order two to five pips below of
neckline. After trigger trader, they place a stop loss below of breakout
candlesticks.
Conservative traders buy close prices of neckline breakout candlesticks
with a place to stop loss below of neckline breakout candlesticks.
Pullback trader put Buy limit order two pips above of neckline after
the confirmed breakout. After trigger trader, they place a stop loss below of
breakout candlesticks.
Aggressive, Conservative, and Pullback traders place take profit level
near swing high or 1: 2 more risk-reward ratio or Triple Bottom Chart
Pattern profit measurement as per their choice.
Head & Shoulder Chart Pattern Entry-Exit Strategy:
Head & Shoulder Chart Pattern:
The Head and shoulders chart pattern is that chart pattern where a large peak has
a slightly smaller peak on either side of it. Forex, equity, commodity, metal,
crypto traders look at head and shoulders patterns for bullish to bearish
reversal prediction.
The first and third peaks will be smaller than the second peak, but they will all fall
back to the same level of support, which is known as the ‘neckline’. When the
third peak breaks the level of support, it will likely breakdown into a bearish
downtrend.
Identify Head & Shoulder Chart Pattern:
Image point number – 1, Price was full of impulsive. You have to watch
the market because any chart or candlesticks pattern will create here.
Image point number- 2, Few time later with impulsive mode price
creates 1 st top. Sellers try to be powerful here.
Image point number- 3, Sellers beats buyers here thus price is
corrective mode now. Time to wait and observe.
Image point number – 4, After corrective mode with create higher low
buyer, is trying to strong here. Wait for a new impulsive mood.
Image point number – 5, Price again impulsive here. As a chart
pattern trader, you have to wait and watch for any chart pattern. 2nd
top created. It’s time to wait and observe to create a double top chart
pattern.
Image point number – 6, After created 2 nd top sellers try to beat buyer
more powerfully here. A great chance to create a double-top chart pattern
here. Let’s draw a neckline.
Image point number – 7, After corrective mode with failure to new,
create higher low or breakdown 1st neckline buyer is trying to strong
here. Wait for a new impulsive mood.
Image point number – 8, Price again impulsive here. As a chart pattern
trader, you have to wait and watch for any chart pattern. 3rd top
created. It’s time to wait and observe to create a Head & Shoulder chart
pattern.
Image point number – 9, Neckline breakdown by candlesticks with
a close below which confirms a Head & Shoulder pattern. It’s entry time.
Entry, Stop Loss, and Exit of Head & Shoulder Chart Pattern:
Aggressive trader put SELL STOP order two to five pips below of
neckline. After trigger trader, they place stop loss above of breakdown
candlesticks.
Conservative traders sell close price of neckline breakdown candlesticks
with place stop loss above of neckline breakdown candlesticks.
Pullback trader put SELL limit order two pips below of neckline after
a confirmed breakdown. After trigger trader, they place stop loss above of
breakdown candlesticks.
Aggressive, Conservative, and Pullback traders place take profit level
near swing low or 1: 2 more risk-reward ratio or Head & Shoulder Chart
Pattern profit measurement as per their choice.
Inverse Head & Shoulder Entry-Exit Strategy:
Inverse Head & Shoulder Chart Pattern:
Inverse Head and shoulders is a chart pattern in which a large bottom has a
the slightly smaller bottom on either side of it. Forex, equity, commodity, metal,
crypto traders look at the inverse head and shoulders patterns for bearish to
bullish reversal prediction.
The first and third-bottom will be higher than the second bottom, but they will all
fall back to the same level of resistance, which is known as the ‘neckline’.
When the third peak breaks the level of resistance, it will likely break out into
a bullish uptrend.
Identify Inverse Head & Shoulder Chart Pattern:
Image point number – 1, Price was full of impulsive. You have to watch
the market because any chart or candlesticks pattern will create here.
Image point number- 2, a Few times later with impulsive mode price
creates 1 st Bottom. Buyers try to be powerful here.
Image point number- 3, Buyers beats sellers here thus price is
reversal mode now. Time to wait and observe.
Image point number – 4, After corrective mode with create lower high
sellers, is trying to strong here. Wait for a new impulsive mood.
Image point number – 5, Price again impulsive here. As a chart
pattern trader, you have to wait and watch for any chart pattern. 2nd
top created. Its time to wait and observe to create a double top chart
pattern.
Image point number – 6, After created 2 nd bottom buyer try to beat
sellers more powerfully here. A great chance to create a double bottom
chart pattern here. Let’s draw a neckline.
Image point number – 7, After corrective mode with failure to new,
create lower high or breakout 1st neckline seller is trying to strong here.
Wait for a new impulsive mood.
Image point number – 8, Price again impulsive here. As a chart pattern
trader, you have to wait and watch for any chart pattern. 3rd bottom
created. Its time to wait and observe to create an Inverse Head &
Shoulder chart pattern.
Image point number – 9, Neckline breakout by candlesticks with a close
below which confirms a triple top pattern. It’s entry time.
Entry, Stop Loss, and Exit of Inverse Head & Shoulder Chart Pattern:
Aggressive traders put BUY STOP order two to five pips below of
neckline. After trigger trader, they place a stop loss below of breakout
candlesticks.
Conservative traders buy close prices of neckline breakout candlesticks
with a place to stop loss below of neckline breakout candlesticks.
Pullback trader put Buy limit order two pips above of neckline after
the confirmed breakout. After trigger trader, they place a stop loss below of
breakout candlesticks.
Aggressive, Conservative, and Pullback traders place take profit level
near swing high or 1: 2 more risk-reward ratio or Inverse Head &
Shoulder Chart Pattern profit measurement as per their choice.
Symmetrical Triangle Chart Pattern Entry-Exit Strategy (SELL):
What is the Symmetrical Triangle:
The Symmetrical Triangle is an area of indecision where the present price is a
pause and future direction is questionable. Also, demand and supply are equal
at this time.
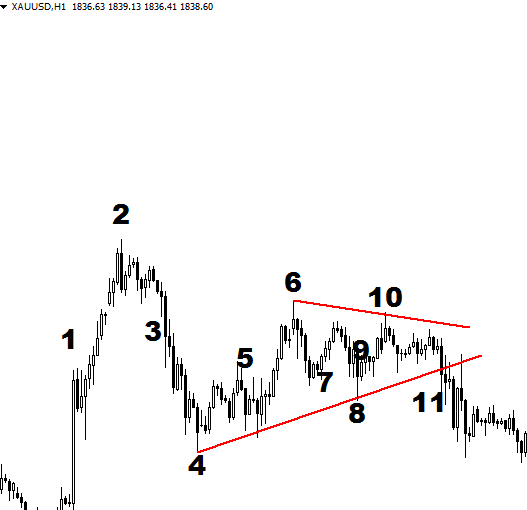
Identify the Symmetrical Triangle Chart Pattern for Sell:
Image point number – 1, Price was full of impulsive. You have to watch
the market because any chart or candlesticks pattern will create here.
Image point number- 2, Few time later with impulsive mode price
creates 1 st top. Sellers try to be powerful here.
Image point number- 3, Sellers beats buyers here thus price is
corrective mode now. Time to wait and observe.
Image point number – 4, After corrective mode price create higher
low. Wait for a new impulsive mood.
Image point number- 5, Price is again impulsive mode now. Time to
wait and observe.
Image point number- 6, But failure to a new higher high. Time to wait
and observe.
Image point number – 7, Sellers beats buyers here thus price is
corrective mode now. Time to wait and observe.
Image point number – 8, After corrective mode price create higher
low. Wait for a new impulsive mood.
Image point number- 9, Price is again impulsive mode now. Time to
wait and observe.
Image point number- 10, But failure to a new higher high. Time to wait
and observe. Let’s draw a symmetrical triangle.
Image point number – 11, Symmetrical triangle breakdown by
candlesticks with a close below which confirms a symmetrical triangle
pattern. It’s entry time.
Entry, Stop Loss, and Exit of Symmetrical Triangle Chart Pattern for Sell:
Aggressive trader put SELL STOP order two to five pips below of
symmetrical triangle. After trigger trader, they place stop loss above of
breakdown candlesticks.
Conservative traders sell close prices of neckline breakdown candlesticks
with place stop loss above of neckline breakdown candlesticks.
Pullback trader put SELL limit order two pips below of neckline after
a confirmed breakdown. After trigger trader, they place stop loss above of
breakdown candlesticks.
Aggressive, Conservative and Pullback traders place take profit level
near swing low or 1: 2 more risk-reward ratio or Symmetrical Triangle
Chart Pattern profit measurement as per their choice.

Symmetrical Triangle Chart Pattern Entry-Exit Strategy (BUY):
Identify the Symmetrical Triangle Chart Pattern for Buy:
Image point number – 1, Price was full of impulsive. You have to watch
the market because any chart or candlesticks pattern will create here.
Image point number- 2, Few time later with impulsive mode price
creates 1 st top. Sellers try to be powerful here.
Image point number- 3, Sellers beats buyers here thus price is
corrective mode now. Time to wait and observe.
Image point number – 4, After corrective mode price create higher
low. Wait for new impulsive mood.
Image point number- 5, Price is again impulsive mode now. Time to
wait and observe.
Image point number- 6, But failure to a new higher high. Time to wait
and observe.
Image point number – 7, Sellers beats buyers here thus price is
corrective mode now. Time to wait and observe.
Image point number – 8, After corrective mode price creates higher
low. Wait for a new impulsive mood. Let’s draw a symmetrical triangle.
Image point number – 9, Symmetrical triangle breakout by
candlesticks with a close below which confirms a symmetrical triangle
pattern. It’s entry time.
Entry, Stop Loss, and Exit of Symmetrical Triangle Chart Pattern for Buy:
Aggressive trader put BUY STOP order two to five pips above of
neckline. After trigger trader, they place a stop loss below of breakout
candlesticks.
Conservative trader BUY close price of neckline breakdown candlesticks with place stop loss below of neckline breakout candlesticks.
Pullback trader put BUY limit order two pips above of neckline after
confirmed breakout. After trigger trader, they place a stop loss below of
breakout candlesticks.
Aggressive, Conservative, and Pullback traders place take profit level
near swing high or 1: 2 more risk-reward ratio or symmetrical triangle
Chart Pattern profit measurement as per their choice.
Ascending Triangle Chart Pattern Entry-Exit Strategy:
What is the Ascending Triangle:
It is the symmetrical triangle variation with bullish formation. When it created
in an uptrend, most reliability assures for the trader.
The top part of the ascending triangle will flat and the bottom part created a higher
low with several times.
The below clause must fulfill when Ascending Triangle Pattern create.
The price must reach a higher high position.
Price is corrective and turned back.
Price tries to touch the previous high.
Price again corrective and turned back.
Price creates new high and bulls are taking full of control.
Minimum two flat top and two higher low required to create the Ascending
Triangle in bullish.
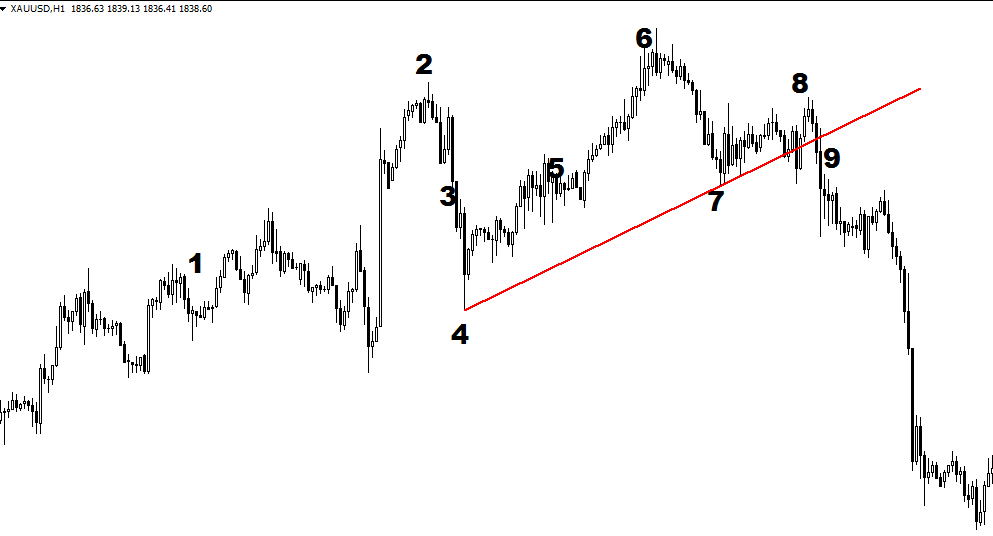
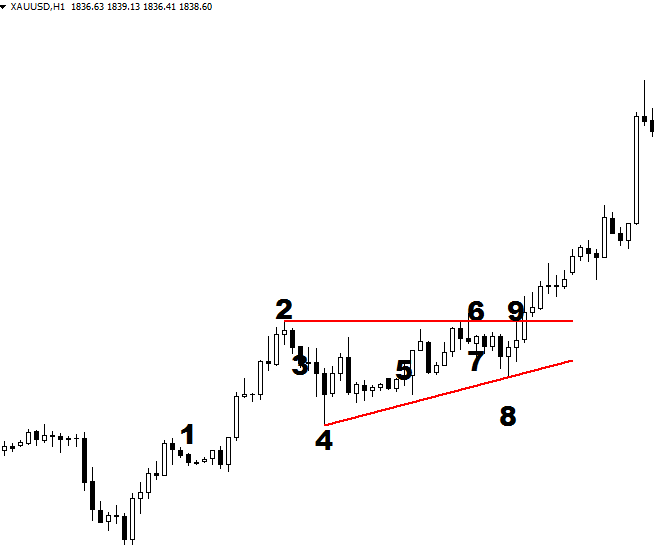
Identify AscendingTriangle Chart Pattern:
Image point number – 1, Price was full of impulsive. You have to watch
the market because any chart or candlesticks pattern will create here.
Image point number- 2, Few time later with impulsive mode price
creates 1 st top. Sellers try to be powerful here.
Image point number- 3, Sellers beats buyers here thus price is
corrective mode now. Time to wait and observe.
Image point number – 4, After corrective mode price create higher
low. Wait for new impulsive mood.
Image point number- 5, Price is again impulsive mode now. Time to
wait and observe.
Image point number- 6, But failure to new higher high. Time to wait
and observe.
Image point number – 7, Sellers beats buyers here thus price is
corrective mode now. Time to wait and observe.
Image point number – 8, After corrective mode price creates higher
low. Wait for a new impulsive mood. Let’s draw the Ascending Triangle.
Image point number – 9, Ascending triangle breakout by candlesticks
with a close below which confirms an Ascending triangle pattern. It’s entry
time.
Entry, Stop Loss, and Exit of Ascending Triangle Chart Pattern:
Aggressive trader put BUY STOP order two to five pips above of
neckline. After trigger trader, they place a stop loss below of breakout
candlesticks.
Conservative trader BUY close price of neckline breakdown candlesticks with placing a stop loss below of neckline breakout candlesticks.
Pullback trader put BUY limit order two pips above of neckline after
the confirmed breakout. After trigger trader, they place a stop loss below of
breakout candlesticks.
Aggressive, Conservative and Pullback traders place take profit level
near swing high or 1: 2 more risk-reward ratio or Ascending triangle
Chart Pattern profit measurement as per their choice.
Descending Triangle Chart Pattern Entry-Exit Strategy:
What is the Descending Triangle:
It is the symmetrical triangle variation with bearish formation. Its create
downtrend with most confirmed.
The bottom part of the Descending triangle will flat and the upper part create
lower high severally.
The below clause must fulfill when Descending Triangle Pattern create.
Price reaches lower low position.
Price corrective and turned back.
Price try to touch previous low.
Price corrective and turned back.
Price create new low and bears are taking full control.
Minimum two flat bottoms with two lower high required to create the
descending triangle in bearish.
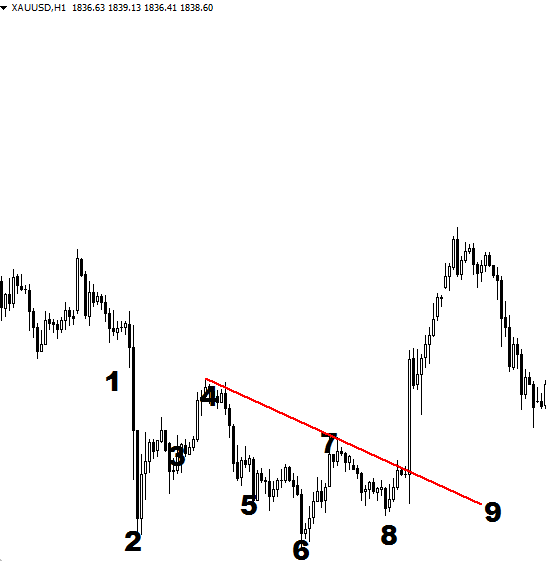
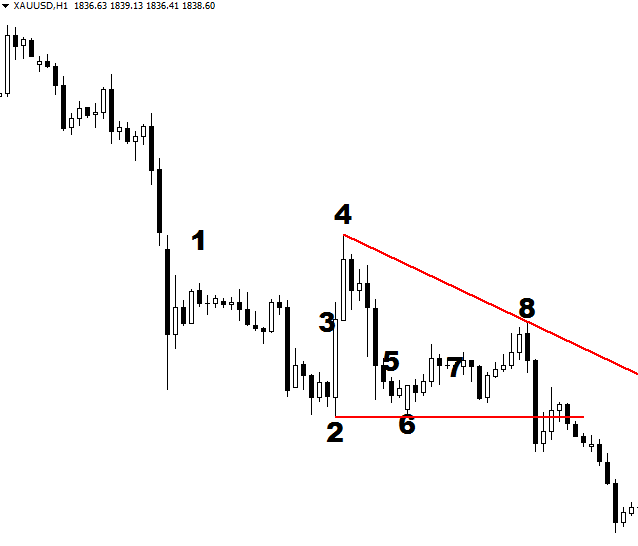
Identify the Descending Triangle Chart Pattern for Sell:
Image point number – 1, Price was full of impulsive. You have to watch
the market because any chart or candlesticks pattern will create here.
Image point number- 2, Few time later with impulsive mode price
creates 1 st bottom. Sellers try to be powerful here.
Image point number- 3, Buyrs beats sellers here thus price is reversal
mode now. Time to wait and observe.
Image point number – 4, After reversal mode price create lower high.
Wait for new impulsive mood.
Image point number- 5, Price is again impulsive mode now. Time to
wait and observe.
Image point number- 6, But failure to a new lower low. Time to wait and
observe.
Image point number – 7, Buyers beats sellers here thus price is reversal
mode now. Time to wait and observe.
Image point number – 8, After reversal mode price creates a lower high.
Wait for a new impulsive mood. Let’s draw the Descending Triangle.
Image point number – 9, Descending triangle breakdown by
candlesticks with a close below which confirms a Descending triangle
pattern. It’s entry time.
Entry, Stop Loss, and Exit of Descending Triangle Chart Pattern:
Aggressive trader put SELL STOP order two to five pips above of
neckline. After trigger trader, they place stop loss below of breakdown
candlesticks.
Conservative traders SELL close price of neckline breakdown candlesticks with placing a stop loss below of neckline breakdown candlesticks.
Pullback trader put Sell limit order two pips above of neckline after
a confirmed breakdown. After trigger trader, they place stop loss below of
breakdown candlesticks.
Aggressive, Conservative, and Pullback traders place take profit level
near swing high or 1: 2 more risk-reward ratio or Descending triangle
Chart Pattern profit measurement as per their choice.
Bullish Flag Pattern Entry-Exit Strategy :
What is Flag Pattern:
The Flag Pattern is a continuation pattern which finds out in the chart after massive
or big bullish or bearish movement. Research has shown that the Flag Pattern is
one of the most reliable continuation patterns for Forex, equity, commodity,
metal, crypto trader.
Bullish Flag must have two or more lower tops and lower bottoms. And
the pattern goes against the uptrend but the channel goes ahead with parallel.
Minimum two lower tops and two lower bottoms required for bullish flag
pattern.
Identify the Bullish Flag Chart Pattern:
Image point number – 1, Price was full of impulsive. You have to watch
the market because any chart or candlesticks pattern will create here.
Image point number- 2, Few time later with impulsive mode price
creates 1 st top. Sellers try to be powerful here.
Image point number- 3, Sellers beats buyers here thus price is
corrective mode now. Time to wait and observe.
Image point number – 4, After corrective mode price create higher
low. Wait for new impulsive mood.
Image point number- 5, Price is again impulsive mode now. Time to
wait and observe.
Image point number- 6, But failure to a new higher high. Time to wait
and observe.
Image point number – 7, Sellers beats buyers here thus price is
corrective mode now. Time to wait and observe.
Image point number – 8, After corrective mode price creates lower
low. Wait for a new impulsive mood. Let’s draw a Bullish Flag Chart Pattern.
Image point number – 9, Bullish Flag Chart Pattern breakout by
candlesticks with a close below which confirms a Bullish Flag Chart
Pattern. It’s entry time.
Entry, Stop Loss, and Exit of Bullish Flag Chart Pattern:
Aggressive trader put BUY STOP order two to five pips above of
neckline. After trigger trader, they place a stop loss below of breakout
candlesticks.
Conservative trader BUY close price of neckline breakdown candlesticks with placing a stop loss below of neckline breakout candlesticks.
Pullback trader put BUY limit order two pips above of neckline after
confirmed breakout. After trigger trader, they place a stop loss below of
breakout candlesticks.
Aggressive, Conservative, and Pullback traders place take profit level
near swing high or 1: 2 more risk-reward ratio or Bullish Flag Chart
Pattern profit measurement as per their choice.
Bearish Flag Pattern Entry-Exit Strategy:
What is Flag Pattern:
The Flag Pattern is a continuation pattern which finds out in the chart after massive
or big bullish or bearish movement. Research has shown that the Flag Pattern is
one of the most reliable continuation patterns for Forex, equity, commodity,
metal, crypto trader.
Bearish Flag must have two or more higher tops and higher bottoms.
And the pattern goes against the downtrend but the channel goes ahead with
parallel.
Minimum two higher tops and two higher bottoms required for bearish flag
pattern.
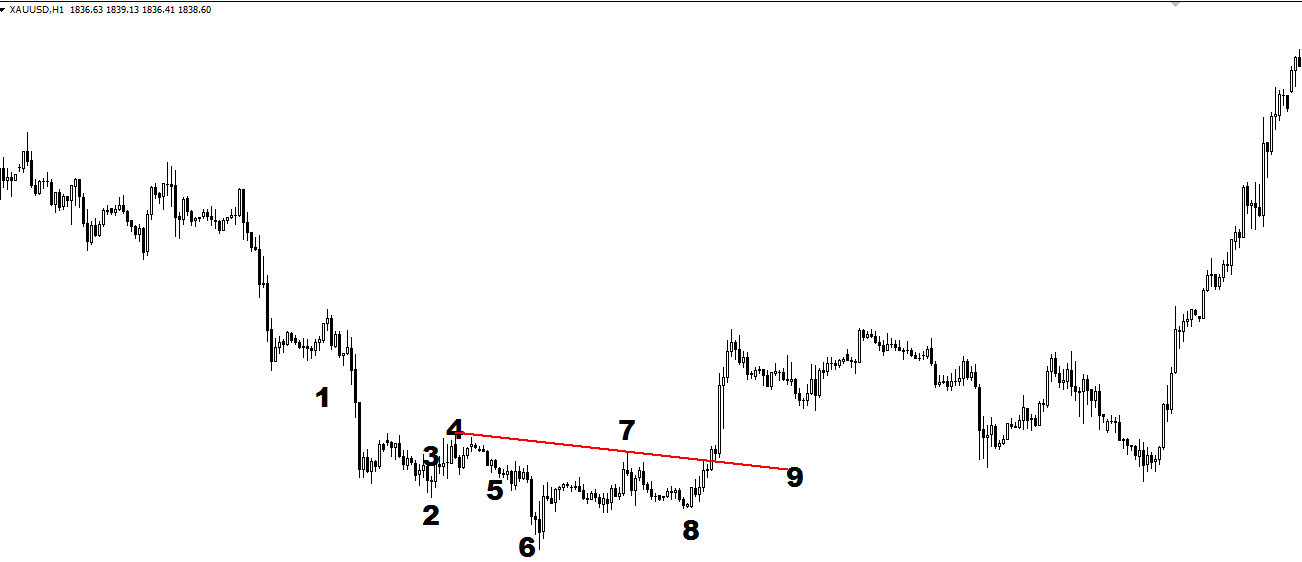
Identify the Bearish Flag Chart Pattern
Image point number – 1, Price was full of impulsive. You have to watch
the market because any chart or candlesticks pattern will create here.
Image point number- 2, Few times later with impulsive mode price
creates 1 st bottom. Sellers try to be powerful here.
Image point number- 3, Buyers beats sellers here thus price is
reversal mode now. Time to wait and observe.
Image point number – 4, After reversal mode price create lower high.
Wait for a new impulsive mood.
Image point number- 5, Price is again impulsive mode now. Time to
wait and observe.
Image point number- 6, Price creates a new lower low. Time to wait and
observe.
Image point number – 7, Buyers beats sellers here thus price is
reversal mode now. Time to wait and observe.
Image point number – 8, After reversal mode price creates a lower high.
Wait for a new impulsive mood. Let’s draw the Bearish Flag Chart Pattern.
Image point number – 9, Bearish Flag breakdown by candlesticks with
a close below which confirms a Bearish Flag Chart Pattern. It’s entry time.
Entry, Stop Loss, and Exit of Bearish Flag Chart Pattern:
Aggressive trader put SELL STOP order two to five pips above of
neckline. After trigger trader, they place stop loss below of breakdown
candlesticks.
Conservative traders SELL close prices of neckline breakdown candlesticks with placing a stop loss below of neckline breakdown candlesticks.
Pullback trader put Sell limit order two pips above of neckline after
a confirmed breakdown. After trigger trader, they place stop loss below of
breakdown candlesticks.
Aggressive, Conservative, and Pullback traders place take profit level
near swing high or 1: 2 more risk-reward ratio or Bearish Flag Chart
Pattern profit measurement as per their choice.
Image13
Bullish Channel Pattern Entry-Exit Strategy:
What is Channel Pattern:
Channel Pattern is actually a continuation pattern. Generally, this Pattern finds
out in the chart after massive or big bullish or bearish movement. Research has
shown that Channel Pattern is one of the most reliable continuation patterns
for forex, equity, metal, and crypto traders. Of course, trend lines must run
parallel. Supply, demand seems balanced at this moment. Thus buyers and
sellers seem control equally.
Bullish channels create two or two more parallel tops and parallel
bottoms. This pattern goes against uptrend but the channel goes ahead
with parallel.
Minimum two parallel tops and bottoms required for bullish channel pattern.
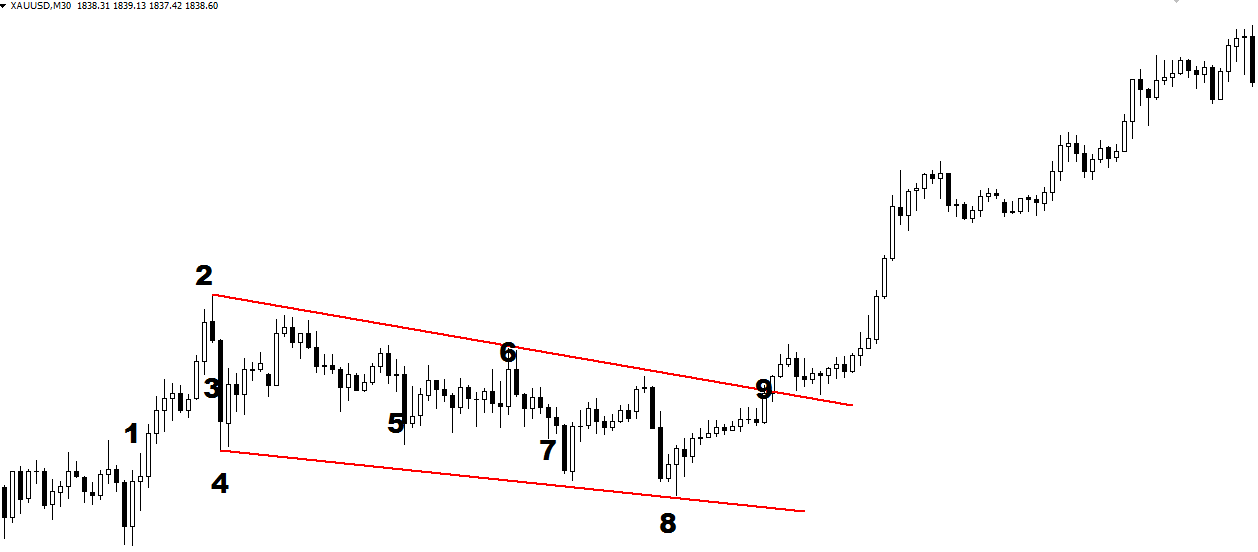
Identify the Bullish Channel Chart Pattern:
Image point number – 1, Price was full of impulsive. You have to watch
the market because any chart or candlesticks pattern will create here.
Image point number- 2, Few time later with impulsive mode price
creates 1 st top. Sellers try to be powerful here.
Image point number- 3, Sellers beats buyers here thus price is
corrective mode now. Time to wait and observe.
Image point number – 4, After corrective mode price creates higher
low. Wait for a new impulsive mood.
Image point number- 5, Price is again impulsive mode now. Time to
wait and observe.
Image point number- 6, But failure to new higher high. Time to wait
and observe.
Image point number – 7, Sellers beats buyers here thus price is
corrective mode now. Time to wait and observe.
Image point number – 8, After corrective mode price failure to create
lower low. Wait for a new impulsive mood. Let’s draw Bullish Channel
Chart Pattern.
Image point number – 9, Bullish Channel Chart Pattern breakout by
candlesticks with a close below which confirms a Bullish Channel Chart
Pattern. It’s entry time.
Entry, Stop Loss, and Exit of Bullish Channel Chart Pattern:
Aggressive trader put BUY STOP order two to five pips above of
neckline. After trigger trader, they place a stop loss below of breakout
candlesticks.
Conservative trader BUY close price of neckline breakdown candlesticks with place stop loss below of neckline breakout candlesticks.
Pullback trader put BUY limit order two pips above of neckline after
the confirmed breakout. After trigger trader, they place a stop loss below of
breakout candlesticks.
Aggressive, Conservative, and Pullback traders place take profit level
near swing high or 1: 2 more risk-reward ratio or Bullish Channel Chart
Pattern profit measurement as per their choice.
Bearish Channel Pattern Entry-Exit Strategy:
What is Channel Pattern:
Channel Pattern is actually a continuation pattern. Generally, this Pattern finds
out in the chart after massive or big bullish or bearish movement. Research has
shown that Channel Pattern is one of the most reliable continuation patterns
for forex, equity, metal, and crypto traders. Of course, trend lines must run
parallel. Supply, demand seems balanced at this moment. Thus buyers and
sellers seem control equally.
A bearish channel creates two or two more parallel tops and parallel
bottoms. This pattern goes against the downtrend but the channel goes
ahead with parallel.
Minimum two parallel tops and bottoms required for a bearish channel pattern.
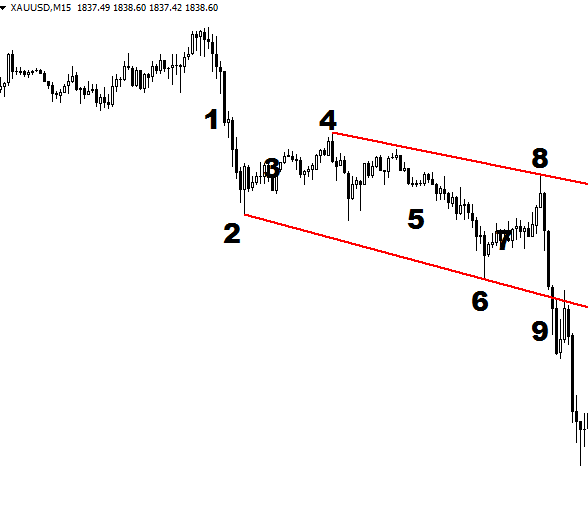
Identify the Bearish Channel Chart Pattern:
Image point number – 1, Price was full of impulsive. You have to watch
the market because any chart or candlesticks pattern will create here.
Image point number- 2, Few time later with impulsive mode price
creates 1 st bottom. Sellers try to be powerful here.
Image point number- 3, Buyers beats sellers here thus price is
reversal mode now. Time to wait and observe.
Image point number – 4, After reversal mode price failure to create
lower high. Wait for a new impulsive mood.
Image point number- 5, Price is again impulsive mode now. Time to
wait and observe.
Image point number- 6, Price again failure to create new lower low.
Time to wait and observe.
Image point number – 7, Buyers beats sellers here thus price is
reversal mode now. Time to wait and observe.
Image point number – 8, After reversal mode price creates a lower high.
Wait for a new impulsive mood. Let’s draw a Bearish Channel Chart Pattern.
Image point number – 9, Bearish Channel breakdown by candlesticks
with a close below which confirms a Bearish Channel Chart Pattern. Its
entry time.
Entry, Stop Loss, and Exit of Bearish Channel Chart Pattern:
Aggressive trader put SELL STOP order two to five pips above of
neckline. After trigger trader, they place stop loss below of breakdown
candlesticks.
Conservative traders SELL close prices of neckline breakdown candlesticks with placing a stop loss below of neckline breakdown candlesticks.
Pullback trader put Sell limit order two pips above of neckline after
a confirmed breakdown. After trigger trader, they place stop loss below of
breakdown candlesticks.
Aggressive, Conservative, and Pullback traders place take profit level
near swing high or 1: 2 more risk-reward ratio or Bearish Channel Chart
Pattern profit measurement as per their choice.
Chart Pattern with alligator strategies click here
~~~~~~~~~~~~~~~~~~~~ THANKS ~~~~~~~~~~~~~~~~~~~~~


