 Earn Money Forex Best Forex Trading Experience


Simple Moving Average (SMA) crossover entry exit strategy
Friends…… earnmoneyfx.com present here with another simple and useful forex trading strategy.
A lot of thanks for being with earnmoneyfx.com
Today our strategy is 10 Simple Moving Average (SMA), 20 Simple Moving Average (SMA), and 200 Simple Moving Average (SMA) crossover entry exit strategy.
Explore this strategy before let’s understand what is Simple Moving Average (SMA) and the structure of Simple Moving Average (SMA) shortly.
Moving Average are various types. E.g. Simple Moving Average (SMA), Exponential Moving Average (EMA), Smoothed Moving Average (SMMA), etc.
Simple Moving Average (SMA) is the most uses of them because of its easy to calculate and understand
Definition and Calculation of Simple Moving Average (SMA):
A simple moving average is formed by calculating the average price of a currency over a specific number of periods.
Most moving averages are based on closing prices; for example, a 5-day simple moving average is the five-day sum of closing prices divided by five.
As its name implies, a moving average is an average that moves.
Old data is dropped as new data becomes available, causing the average to move along the time scale.
The example below shows a 5-day moving average evolving over three days.
Daily Closing Prices: 11,12,13,14,15,16,17
First day of 5-day SMA: (11 + 12 + 13 + 14 + 15) / 5 = 13
Second day of 5-day SMA: (12 + 13 + 14 + 15 + 16) / 5 = 14
Third day of 5-day SMA: (13 + 14 + 15 + 16 + 17) / 5 = 15
The first day of the moving average simply covers the last five days.
The second day of the moving average drops the first data point (11) and adds the new data point (16).
The third day of the moving average continues by dropping the first data point (12) and adding the new data point (17).
In the example above, prices gradually increase from 11 to 17 over a total of seven days.
Notice that the moving average also rises from 13 to 15 over a three-day calculation period.
Also, notice that each moving average value is just below the list price. For example, the moving average for day one equals 13 and the last price is 15. Prices the prior four days were lower and this causes the moving average to lag.
For your kind information, Any moving average strategy is a trend trading system.
Moving Average work well when prices are up to trend or downtrend.
In a choppy or sideways market moving average strategies are unable to well.
So we always avoid using moving average strategies when markets are choppy or sideways.
Otherwise its chance to hit stop loss more and more.
Simple Moving Average is the default indicator in Metatrader4 or Metatrader5.
Metatrader4 Simple Moving Average plot as below
Open Metatrader4 > Insert > Indicator > Trend > Moving Average> Simple > OK
Let’s explore strategy
As per the earnmonreyfx.com research team demo test, This strategy works well any timeframe and any pair.
For good success rate we suggest you One Hourly, Four Hourly, Daily timeframe and major pair (EURUSD, GBPUSD, AUDUSD, NZDUSD, USDCHF, USDCAD, USDJPY, EURJPY, GBPJPY), XAUUSD, XAUEUR, CRUIDE OIL and S&P500
Important things,
We will take our BUY decision when the price is above 200 Simple Moving Average.
Also, We will take our SELL decision when the price is below the 200 Simple Moving Average.
BUY Rules:
- At first, we will find out that is 10 Simple Moving Average crossing above 20 Simple Moving Average.
This swing trading strategy, 10 Simple Moving Average called faster Moving Average and 20 Moving Average called slower Moving Average.
If faster Moving Average crosses slower Moving Average that’s a signal for trend changes.
Please be careful it’s not our buy entry signal, it’s just a trend changing signal.
- The price crossed above the 200 Simple Moving Average curve.
- 10 Simple Moving Average crossed above 200 Simple Moving Average.
- 20 Simple Moving Average crossed above 200 Simple Moving Average.
- Let’s wait for price come back near, below, or touch 10 Simple Moving Average or 20 Simple Moving Average or 200 Simple Moving Average. It will very good when the price is between three Simple Moving Average.
- Look for bullish price action reversal candlesticks pattern (PIN BAR, BULLISH ENGULFING, MORNING STAR, HAMMER, HARAMI, PIERCING, DOJI, etc.)
Entry: Place BUY STOP pending order at least two to five pips above of bullish price action reversal candlesticks.
Stop Loss: Two to five pips below of bullish price action reversal candlesticks or near swing low.
Take Profit: Take Profit will be near resistance / Swing Low or 1:2 or 1:3 of risk-reward ratio.
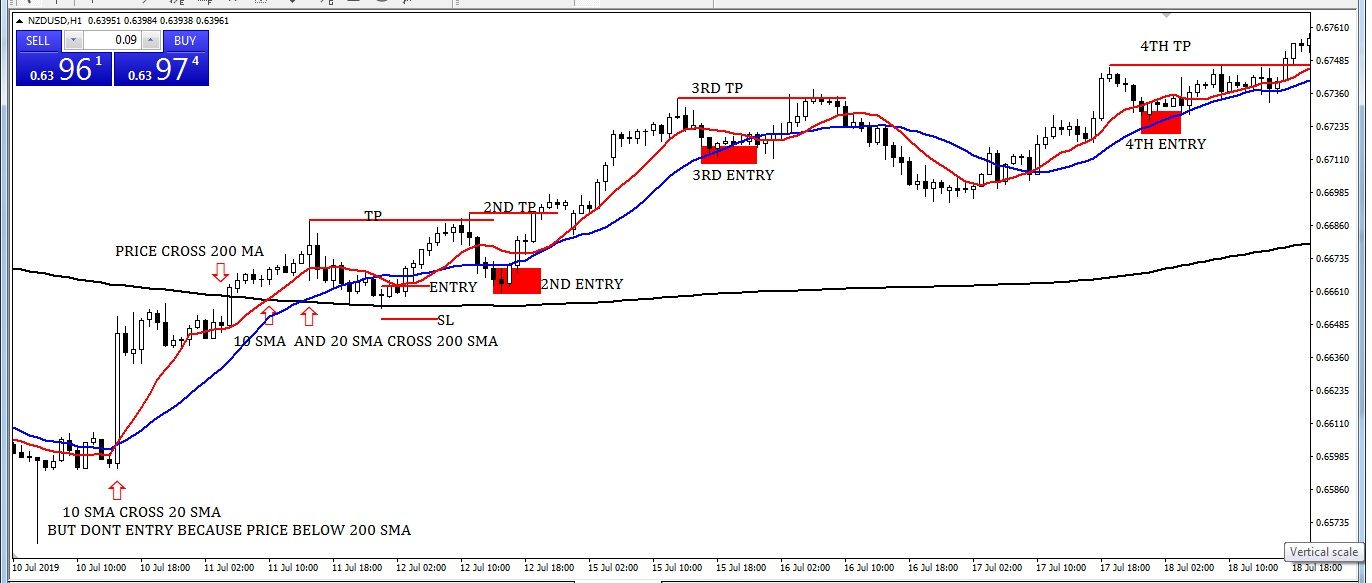
Image 1: 10 Simple Moving Average, 20 Simple Moving Average, and 200 Simple Moving Average crossover Entry and Exit (BUY).
SELL Rules:
- At first, we will find out that is 10 Simple Moving Average crossing below 20 Simple Moving Average.
This swing trading strategy, 10 Simple Moving Average called faster Moving Average and 20 Moving Average called slower Moving Average.
If faster Moving Average crosses slower Moving Average that’s a signal for trend changes.
Please be careful its not our sell entry signal its just a trend changing signal.
- The price crossed below the 200 Simple Moving Average curve.
- 10 Simple Moving Average crossed below 200 Simple Moving Average.
- Let’s wait for price come back near, below or touch 10 Simple Moving Average, 20 Simple Moving Average and 200 Simple Moving Average. Its will very good when price is between three Simple Moving Average.
- Look for bearish price action reversal candlesticks pattern (PIN BAR, BEARISH ENGULFING, SHOOTING STAR, HARAMI, DARK CLOUD COVER, DOJI etc.)
Entry: Place SELL STOP pending order at least two to five pips below of bearish price action reversal candlesticks.
Stop Loss: Two to five pips above of bearish price action reversal candlesticks or near swing High.
Take Profit: Take Profit will be near Support / Swing High or 1:2 or 1:3 of risk-reward ratio.
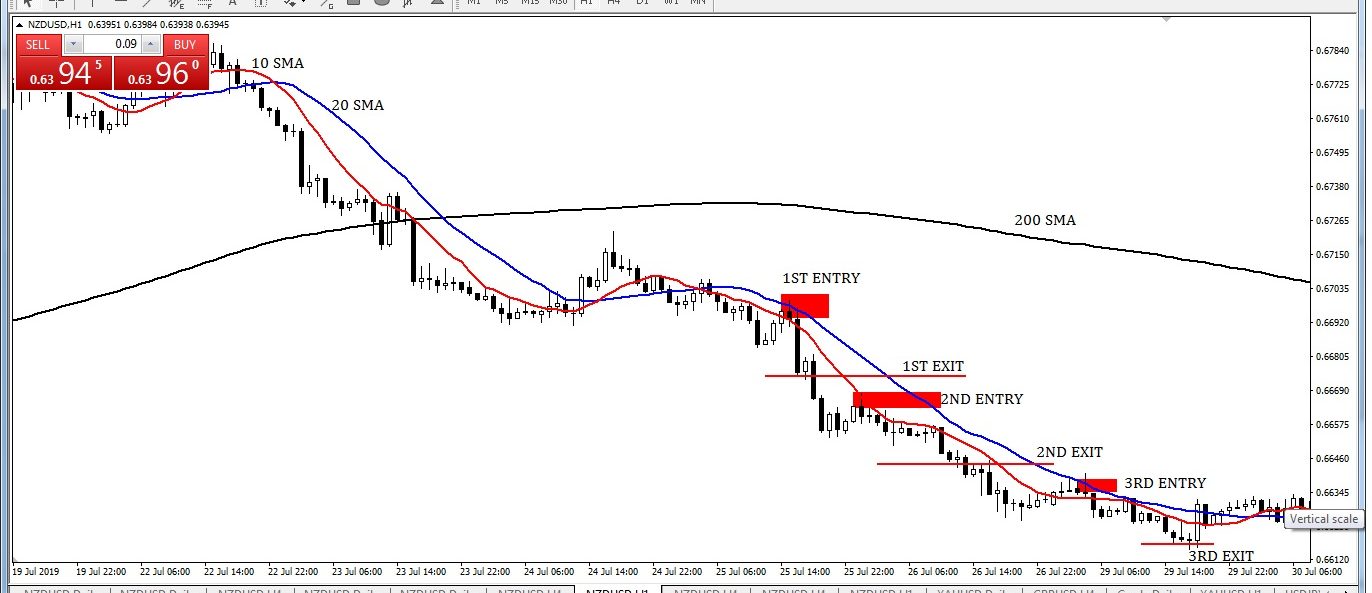
Image 2: 10 Simple Moving Average, 20 Simple Moving Average, and 200 Simple Moving Average crossover Entry and Exit (SELL).
For your kind information, Every Strategy has a few Advantages and Disadvantages.
10 Simple Moving Average, 20 Simple Moving Average, and 200 Simple Moving Average crossover strategy.
Advantages:
>>> This strategy is an easy and simple strategy. Also easy to understand and execute.
>>> In trending market it will give you a lot of pips if you execute this strategy properly.
>>> This strategy also good as a swing trading strategy. You will entry and exit in a lot of time until price crosses below 200 Simple Moving Average (For BUY) and price crosses above 200 Simple Moving Average (For SELL).
>>> Also You will entry and exit in a lot of time until 10 Simple Moving Average cross 20 Simple Moving Average above of 200 Simple Moving Average (For BUY) and 10 Simple Moving Average cross 20 Simple Moving Average below of 200 Simple Moving Average (For SELL).
>>> Three moving average filter your entry more accurately.
>>> This strategy Risk Reward Ratio also good.
Disadvantages:
>>> Simple Moving Average is not a leading indicator. It’s a lagging indicator. For that reason, it provides a buy or sells signals lately. Price move so ahead thereafter Simple Moving Average indicator gives us to buy or sell signal.
>> Choppy or Sideways market it’s don’t work. Also gave a lot of false signals which will affect your risk-reward ratio or strategy-wise profit loss statement. So it will be smart if you avoid in a sideways market.
Simple Moving Average (SMA) crossover entry exit strategy
For your kind information, Ninety-Five percent strategies gave false signals in a sideways market.
———— Thanks for visit earnmoneyfx.com and read this article ————


