 Earn Money Forex Best Forex Trading Experience


simple moving average trading strategy
Moving averages are simply a method to help smooth out price fluctuations
plotted on a chart. Like all technical indicators, moving averages serve the
same basic function, which is to help us predict the movements of price in
the future. By observing the movements and slopes of the moving average,
we have another prediction tool in helping us determine what the current
trend is, and perhaps where prices are heading. Below you can see a basic
moving average represented in Blue.

Simple Moving Average (SMA)
In the context of technical analysis, a simple moving average (SMA) is the least complex
of all moving averages. A SMA is obtained simply by totaling up “X” daily closing prices
and dividing that total by that“X” number.
For example, if you wish to plot a 5 period SMA on a one hour chart, you have to add
up the closing prices of last 5 hours and dividing that total by 5
These calculations are done by the charting software which you are using. All you need
to do is to understand the principle of how these SMA are arrived at.
Below is an example of how SMAs are displayed.
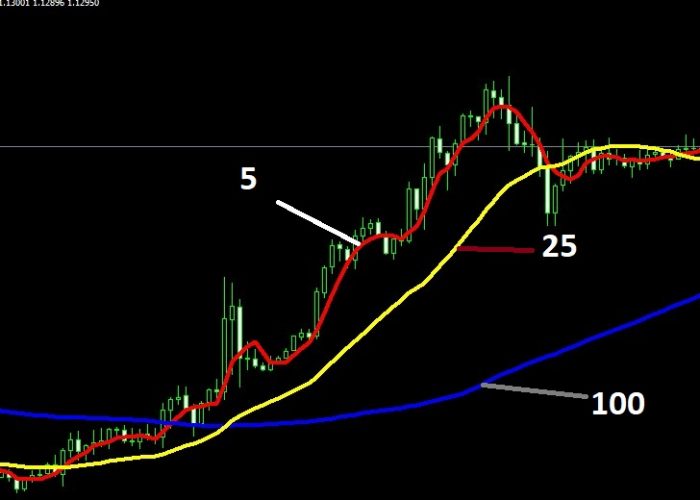
On the preceding figure, one can view 3 differing SMAs. As one can see, the quantity
of price lag depends on the time scale of the SMA. The 100 SMA is furthest away from
the plotted current as compared to the 5SMA and 25 SMA. This is due to the fact that
the 100 SMA is averaged out over 100 time period.
The longer the time period, the shallower the curve of the SMA is. The SMAs in the
above figure shows an overview of the current market sentiment at a specific point in
time. The SMAs allow us to have a broader picture of the market as compared to the
current price thus we can have an overall prediction of the future price.
Exponential Moving Average (EMA)
As useful as the SMA isas a tool for us to predict the overall sentiment of the market, it
has one major defect. SMAs are prone to spikes anomalies. For example, when we plot
a 5 period SMA for a EUR/USD daily chart with the closing prices listed below:
• Day 1: 1.3345
• Day 2: 1.3350
• Day 3: 1.3360
• Day 4: 1.3365
• Day 5: 1.3370
The simple moving average would come out to be:
If the price of day 2 is instead 1.3300, the consequence would that the average become
substantially lower giving the notion that the price is in a downtrend. In reality, this might
be a one off event, perhaps due to decreasing interest rates. At times, SMAs are too
straightforward without taking into consideration anomalies.
It is possible to filter out these spikes anomalies with the use of Exponential Moving
Average (EMA) so that you have a more realistic picture of the general trend of the
market. EMAs give more emphasis to the latter periods. With reference to the above
example, this would mean prices of day 3 to day 5 are given more importance. Thus
the spike of price in day 2 will have significantly less effect on the moving average. In
short, EMAs give more significance to what the market participants are doing NOW.
Historical movements might be important for analysis but it is more crucial to know how
the market is reacting now than what had happened last week or the previous month.


