Earn Money Forex Best Forex Trading Experience

Relative Strength Index (RSI)
This is an oscillator that was developed by J. Welles Wilder. What the Relative Strength
Index (RSI) does is to compare uptrend prices with downtrend prices over a specified
period. It also helps to isolate overbought and oversold market conditions. With a scale
of 0 to 100, any reading below 20 to 30 indicates an oversold condition while any
reading above 70 to 80 indicates an overbought market condition.

Utilizing the Relative Strength Index
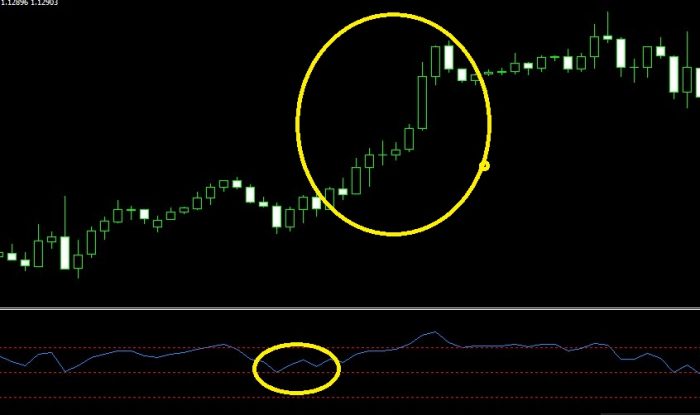
The RSI can be used in a number of ways, however many take note not only on its
overbought or oversold reading, but also to help solidify trend confirmation if it crosses
the middle line (a 50 reading you can see below). For instance, it is one thing to see if
an asset has extended too high or low, but you can also witness if an asset has been in
the lower range (below 50) for some time and finally broke above into the higher range
(above 50) further confirming an uptrend has been established (and vice-versa).
Forex trading technical analysis click here