 Earn Money Forex Best Forex Trading Experience

Chart Is Your Friend-How to trade with looking chart
Marking the zones on your chart is as simple as drawing a line on the chart.
However, if you have not looked at charts in terms of support and resistance zones before, it may be a bit difficult to find precisely where these
zones are located. It is important that, as an Fx trader, you “see” these
zones. One brilliant method for finding zones on the chart, and this works
particularly well for those traders who are new to finding zones on the
chart, is to move to a line chart. Most charting packages will allow you to
view the market on a line chart. A line chart is a chart that offers a continuous line,
connecting the closing prices. Rather than showing the open, the
high, the low, and the close, such as a candlestick chart, or a bar chart, the
line chart simply connects the closing prices
Double-Top Strategy
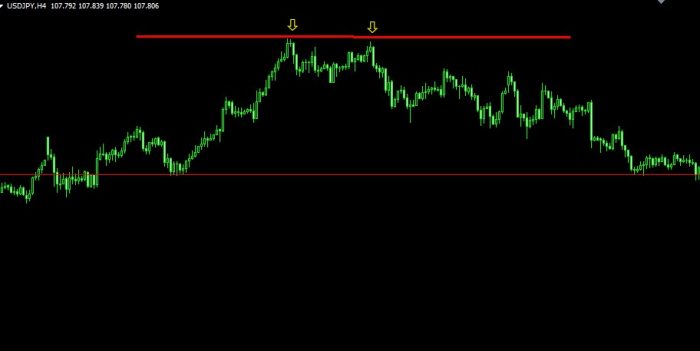
Take a look at the daily USD/JPY chart. Where would
Do you draw the zone?
Now, take a look at the line chart in images. Where would you draw
the zones on this chart?
It is very obvious in the picture that a zone should be drawn at x.0xxxx,
and this is the beauty of the line chart. The line chart allows you to find
those areas on the chart where price has “bent”—the line chart helps us
to identify zones because the line chart shows where price has repeatedly
bent, each bend on the line chart is a potential zone. Those places on the
line chart with several bends are zones.
Line charts may also be extremely useful for those charts where
price doesn’t seem to be respecting a zone. Take a look at the GBP/USD
Breakout Trend Strategy
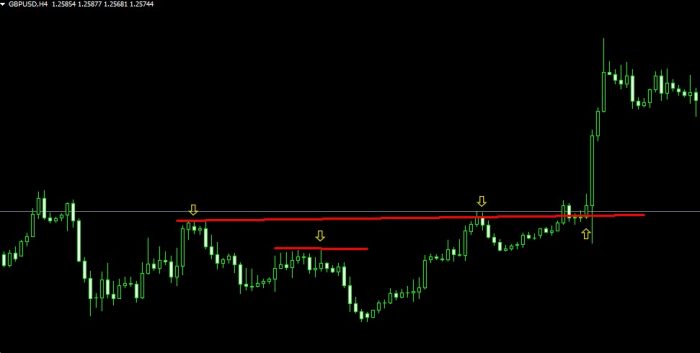
the four-hour chart in Picture. See how market prices are all over the shop
and price does not seem to respect any zone? Perhaps there is a support
and resistance zone hidden on the chart. Maybe it is there, but it is not
immediately obvious where this zone is located.
When a chart looks like this, it may be difficult to spot the zone.
Perhaps there is no zone on this chart? For these charts, the line chart may
come to the rescue. A line chart may save you from sloppy price action
on the charts. A line chart may make clear what is otherwise muddled
and difficult to decipher. Line charts are absolutely critical for the naked
trader.
Notice how the price movement on the chart in images becomes clear and the zone is now obvious.
Because the line chart takes into
Indecision Candle Price Action Strategy
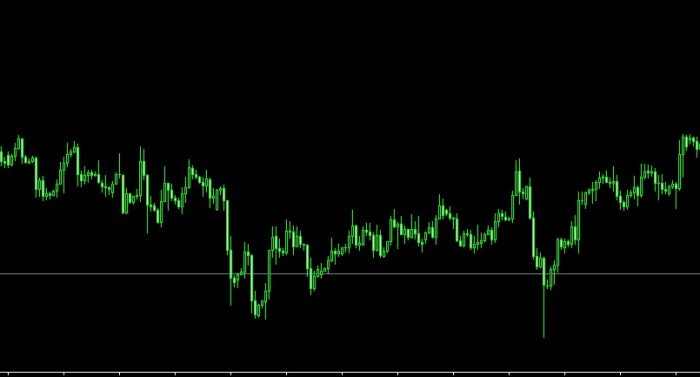
consideration only the closing price, it is a very simple way to view price
action.
Simple moving average formula click here


