 Earn Money Forex Best Forex Trading Experience

Introduction:-
Ichimoku Kinko Hyu, commonly referred to as Ichimoku, is one of the best systems available for
trading the markets. The Ichimoku indicator can be applied to stocks, commodities, futures, currencies
and bonds. If you can chart it, you can apply Ichimoku to it. It works very well on all time frames,
from the weekly all the way down to one minute chart. For those familiar with candlestick charts,
Ichimoku charts are a default extension of Japanese innovation.
Loosely translated, Ichimoku chart means a ‘one glance equilibrium’ chart. Once a trader is familiar
with the components of an Ichimoku system, it should take no more than a glance to decide if
the chart is bullish or bearish. This was the purpose with which Goichi Hosoda invented this
system. Goichi was a Japanese reporter who wanted to create an all-in-one indicator to visually
depict the market’s sentiment in the chart.
After fine tuning it for many years, he finally published his
findings in Japan in the late 1960s. This was the first publication on Ichimoku system and it got
rapidly adopted by the Japanese traders and across Asia. Ichimoku started getting a following in the
Western world in the 1990s as computers became widespread. The computation involved in
developing and displaying the indicator got a lot easier with the help of computers. Most charting
platforms today offer Ichimoku as an indicator.
Ichimoku is a Trend Following System:
Most successful traders make their money trading trends. It is extremely difficult to derive profits
from a non-trending market. Ichimoku helps mitigate this issue to a certain extent. It helps the trader in
identifying non-trending markets, so that they can be avoided. As you will read in the next chapter,
the Ichimoku system has a built-in zone, called the Kumo cloud, which signifies consolidation.
Traders need to be extra cautious initiating trades when the price is within the Kumo, as it is then in a
non-trending phase.
The individual components of Ichimoku are designed to provide the following information:
Is the chart bullish or bearish?
Is the chart displaying consolidation of price?
If the chart is bullish, is there momentum in the trend?
If the chart is bearish, is there momentum in the trend?
If a chart is consolidating, how long would it be before the consolidation might get over?
Where is the price equilibrium? For bullish markets, this would be support; and for bearish
markets this would be resistance.
Future Projection and Past Influence:
Another in-built feature of Ichimoku is the projection of future price action. Goichi firmly
believed that current price action has repercussions in the future. Demand and supply available in the
present will create support and resistance in the future. Based on this assumption, the Ichimoku
system is designed to project dynamic support and resistance values 26 periods ahead in time. No
other indicator has such a future predicting feature.
Just as the present affects the future, the past also influences the present. Accordingly, prices from 26
periods ago are given great importance in the Ichimoku system. As Chapter 2 describes, traders need
to be particularly aware of this phenomenon.Forex trading strategy Ichimoku Kinko Hyu final addition pro
I would urge the reader to read and re-read Chapters 2 and 3 until the Ichimoku components and their
significance is clear and well understood. Chapters 4 and 5 constitute a practical guide to Ichimoku
trading.
Welcome to the world of Ichimoku! You will profit from it.
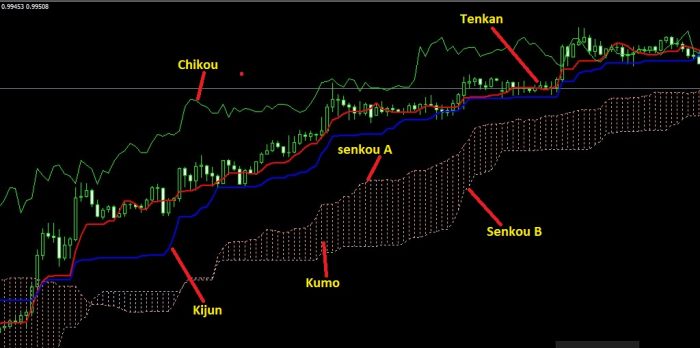
Ichimoku Components:-
The Ichimoku system has five components to it:
Tenkan;
Kijun;
Senkou A;
Senkou B; and
Chikou.
The Senkou A and Senkou B together form a structure commonly known as the Kumo cloud.
We will explain the five components in this chapter. Keep in mind that these components are highly
effective when used as a system. Chapter 3 will deal in detail about integrating the five components
together to form a trading system.
Tenkan:
also known as ‘the Conversion Line,’ is calculated by averaging the highest high and the
lowest low of the previous 9 periods. Keep in mind that the Japanese place a lot of importance on
how the price behaves during the entire trading period. The high and the low of the day are as
important as the open and close of the candle on the candlestick chart. The high point of the candle is
where demand was overcome by supply and the low point of the candle is where supply was
absorbed by the demand. This is the crucial point of candlestick charts and is carried over in the
Ichimoku as well.
In other words, the average of the high and low will give the equilibrium of
price for that period. So the average of highest high and lowest low of the last 9 periods will
provide an equilibrium point for price over the previous 9 periods.
Tenkan = (Highest high of 9 periods + Lowest low of 9 periods) ÷ 2
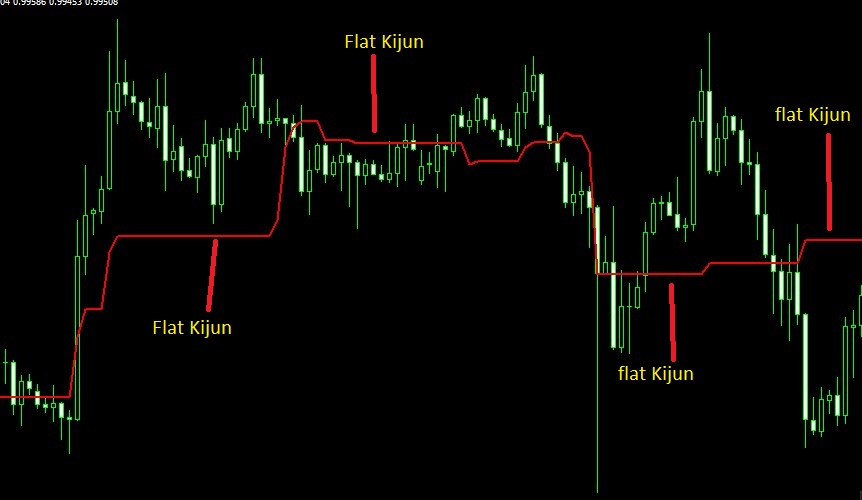
Please note that the Tenkan differs from the 9-period exponential moving average (EMA) and the 9-
period simple moving average (SMA). Both SMA and EMA are based on closing prices and are
much smoother than Tenkan. Tenkan, by its very nature, will exhibit periods of flattening as can be
seen in Figure
 Figure 2.1: Tenkan versus EMA and SMA
notice the flattening of Tenkan in the right hand part of the chart
If a stock jumps up and then starts moving sideways without making any new 9-period highs, then the
Tenkan will go flat thus visually indicating that price is consolidating. At that point, either the price
will come down to the Tenkan to find equilibrium or, after 9 periods, the Tenkan will start to rise to
support the price.
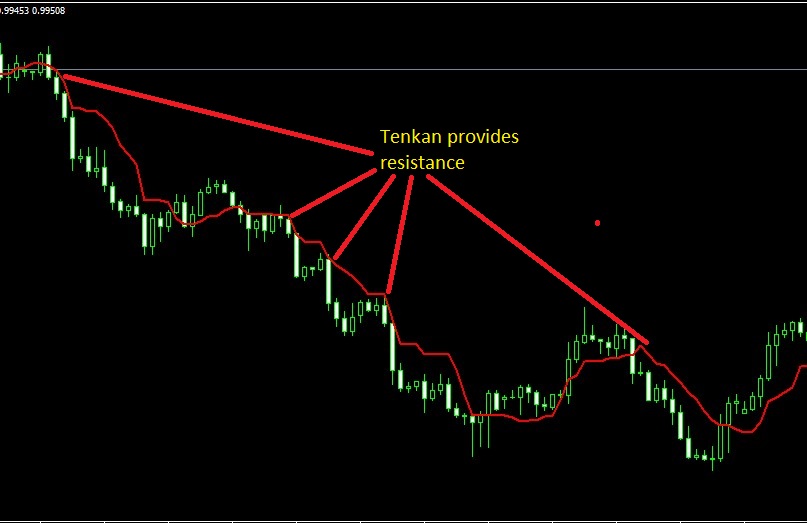
One can think of Tenkan as a short term “magnetic” guide for the price. Price cannot stray too
far from the equilibrium that Tenkan represents. For stocks in an uptrend, Tenkan acts as a
minor support level. On the other hand, for stocks in a downtrend, Tenkan provides minor
resistance.
You can see how Tenkan keeps providing support for the price in the chart of Axis Bank in Figure 2.2.
Price often times breaks the Tenkan intraday, but closes back above it indicating bulls coming in to
defend the equilibrium.

Correspondingly, chart of Bajaj Hindustan in Figure 2.3 shows the various times that Tenkan provided
resistance to any potential reversal in price
Kijun:
The Kijun, also called the ‘Base Line’ is primarily a trend container. It is calculated by averaging
the highest high and the lowest low of the previous 26 periods. Just like the Tenkan, the period can
mean a 1-minute, 5-minute or any other time frame. So the formula for Kijun is as follows:
Kijun = (Highest high of 26 periods + Lowest low of 26 periods) ÷ 2
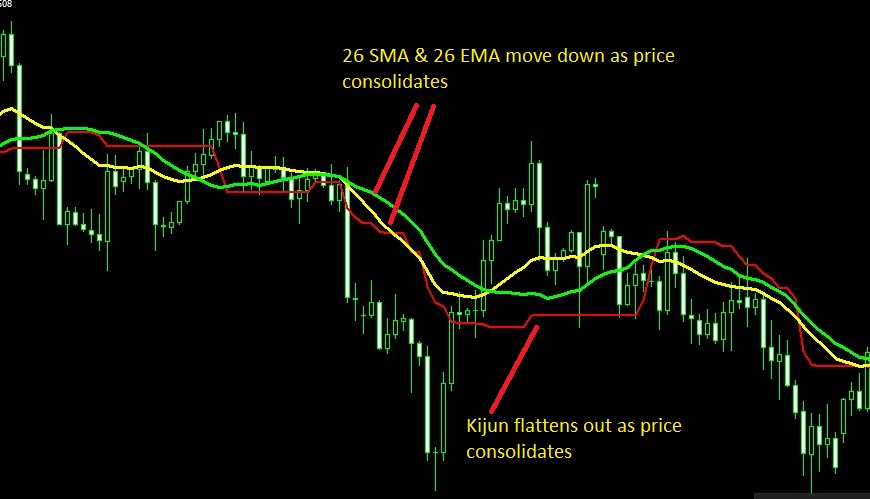
Traders should not compare Kijun to a regular 26-period simple moving average or exponential
moving average. As the chart in Figure 2.4 shows, the Kijun is more sensitive to price highs and
lows and does not care about prices moving within the 26-period high / low areas. In the chart in
Figure 2.4, you would notice that while the 26-period SMA and EMA keep moving up, the Kijun goes
flat. The Kijun denotes equilibrium between the buyers and sellers. If prices over the last 26
Forex trading strategy Ichimoku Kinko Hyu final addition pro
periods are fluctuating in a range, the equilibrium will be at the mid-point of this range. This point
will attract prices back to it like a magnet. As Figure 2.4 shows, the EMA and SMA are lagging
indicators. Even though prices started going lower, these moving averages kept going higher. The
Kijun will be horizontal as soon as the stock stops making new highs and consolidates.
If prices are above the Kijun, it is considered bullish.
If prices are below the Kijun, it is considered bearish.
Can the price move below the Kijun intra-time period? Sure it can. The key is that it should not close
decisively below it. As long as prices close above the Kijun, the stock is considered in an uptrend.
Once the price closes below it, the uptrend is considered broken. This does not mean a downtrend
has started. As you will see in the later chapters, all the Ichimoku components together alone tell the
whole story.
Notice how the Tata Power stock in Figure 2.5 occasionally dipped below the Kijun during the
uptrend until it finally broke down and closed below it.

The Kijun provides strong support for the price in an uptrend. It also offers a strong resistance to the
price in a downtrend
Prices cannot get too far away from the Kijun. Again, keep in mind that the Kijun represents
equilibrium. Prices need to always be in sync with the equilibrium. That is where demand and supply
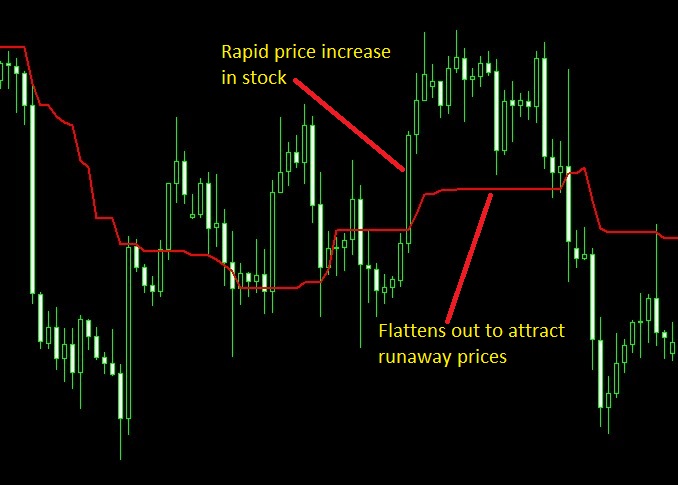
are balanced. Consider the chart in Figure 2.6 to understand how the Kijun acts as a magnet for
prices.
After the downtrend, some event occurs to trigger exuberant buying in the stock. This can be seem in
the middle of the chart. This surge in demand leads to an exponential price increase in a short period
of time. Prices cannot keep rising that fast for too long, however. This leads to the Kijun initially
reacting to the price, from about 27 June till about 11 July, but then going flat as the stock could not
make new highs. The flat Kijun now starts attracting the price back to it.
Scenarios of exiting a trade when the price has considerably extended from Kijun, will often lead to
losses. They are best avoided for swing trading.
Figure 2.7 shows such a quick move to the upside. Anyone would want to take profits off the table if
presented with a 28% gain in a couple of weeks. Now, if enough traders decide to take profits, then
guess where the stock is heading? Down to its equilibrium!
Ichimoku allows the trader to visually anticipate when the equilibrium is going to shift up or down.
Since we know that the Kijun is the average price of the highest high and lowest low of the previous
26 periods, one can notice from the chart if any of those two parameters are due for a change. Study
the chart of Axis Bank in Figure 2.8. Can you predict what Kijun will do the next day?
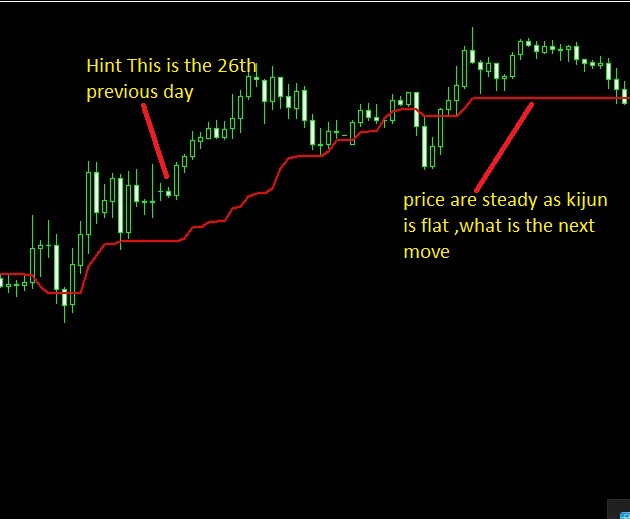
Since the low of 25 days back was higher than the low 26 days ago in the case of Axis Bank
), the Kijun will move up. As the lows keep getting higher, one can expect the Kijun to
trend up nicely to support the stock.
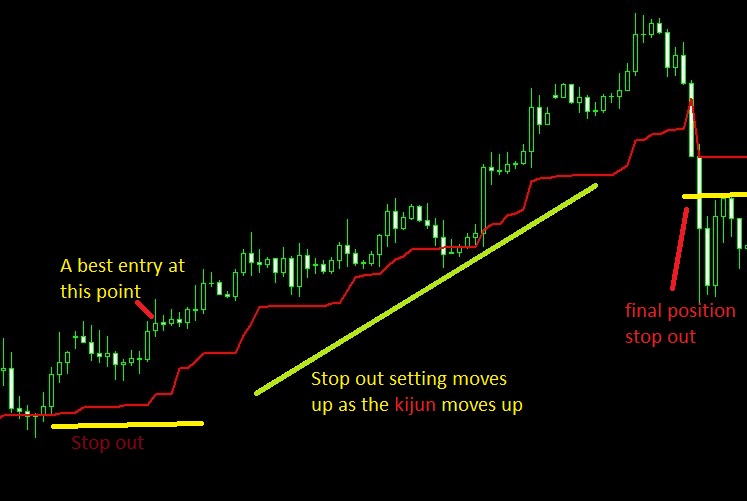
Kijun as a Stop Loss Point
The Kijun is often used as the stop loss point in a trade. A small buffer allowing for intraday
movement (assuming a daily chart) should be used below the Kijun for setting the stop loss. In an
uptrend, as the stock makes new 26-period highs, the Kijun will start moving up. This allows the
trader to move up the stop loss setting as well. Forex trading strategy Ichimoku Kinko Hyu final addition proThis helps in two ways.
1. It reduces any potential loss until the trade reaches breakeven.
2. Once the trade reaches breakeven, it allows the trader to lock in more profits as the equilibrium
moves up.
Notice how in Figure 2.9, the stop out setting for the stock keeps moving higher allowing the trader
to lock in bigger profits as the trade progresses
Kumo:
The Kumo is the heart of the Ichimoku system and is commonly referred to as the cloud. It is
made up of two individual components, the Senkou A and Senkou B. We will first look at each of
these components and then discuss their aggregation into the Kumo cloud
Senkou A
Now that you are familiar with the Tenkan and Kijun, it is easy to understand the Senkou A, also
referred to as ‘Span A.’
Senkou A is the average of the two components, namely Tenkan and Kijun, and is projected 26 days in
the future on the chart.
Senkou A = (Tenkan + Kijun) ÷ 2
Figure 2.10 shows the relationship between Tenkan, Kijun and Senkou A.
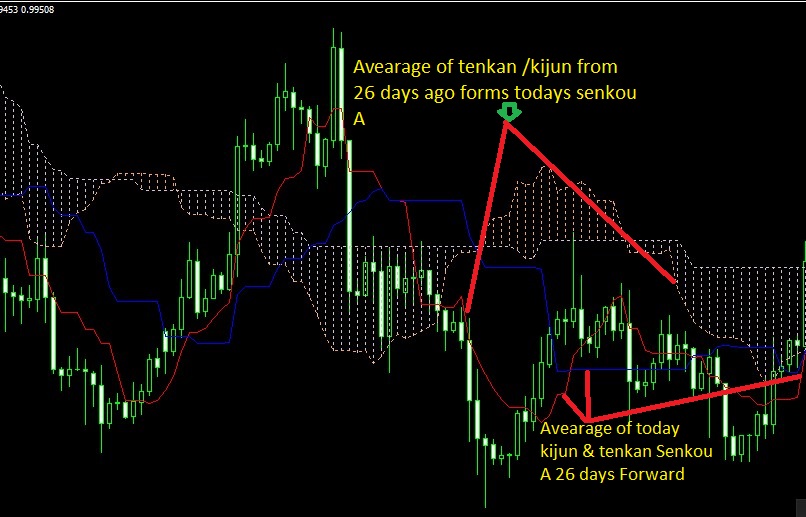 Figure 2.10: Senkou A — and its relationship with Tenkan and Kijun
To make it clearer, today’s Senkou A would be formed by averaging the Tenkan and Kijun values of
26 days ago. On the same note, today’s Tenkan and Kijun values, when averaged, will create the
Senkou A point 26 days in the future.
If the Senkou A (26 days in the future) is rising, it is considered bullish for the stock.
If it is declining, then the stock would be considered to be in a bearish mode.
The current Senkou A can provide support for a rising stock (see Figure 2.11).

Correspondingly, it can provide resistance for a declining stock (see Figure 2.12). This is especially
important if the indicator is flat.

Senkou B
This component of the Kumo is calculated by averaging the highest high and lowest low of the prior
52 periods and projecting it 26 periods into the future. It is essentially the equilibrium for prices over
the past 52 periods, plotted 26 days in the future on the chart.
Senkou B = (Highest high of prior 52 periods + Lowest low of prior 52 periods) ÷ 2
Again, to make it clearer, today’s Senkou B value was formed 26 days back. The value that one sees
on the chart in Figure 2.13, 26 days in the future was arrived at by averaging the highest high and the
lowest low period by the price over the past 52 periods, starting from today.
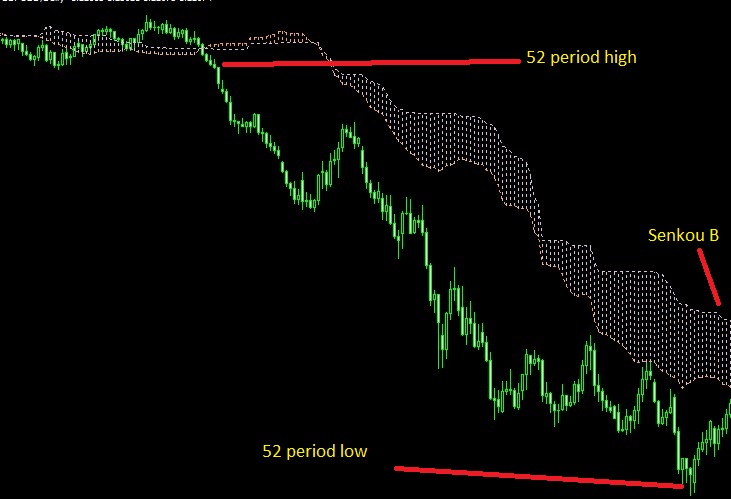 Figure 2.13: Senkou B’s value of for 26 periods (in this case, days) in the future is the average of the
highest high and the lowest low of the past 52 periods
Now, this is what Senkou B tells us:
If Senkou B is rising in the future, the stock is considered bullish.
If, on the other hand, Senkou B is declining in the future, then the chart is considered bearish.
Like Senkou A, the current Senkou B can also provide support and resistance to the stock price (see
Figure 2.14 and Figure 2.15). This support or resistance is especially strong if Senkou B is trending
horizontal. Keep in mind that it is a longer term equilibrium point.
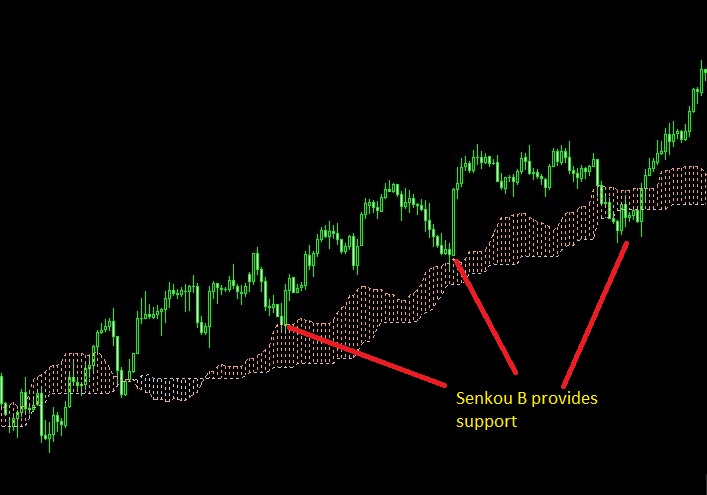 Figure 2.14: Senkou B providing support to the price
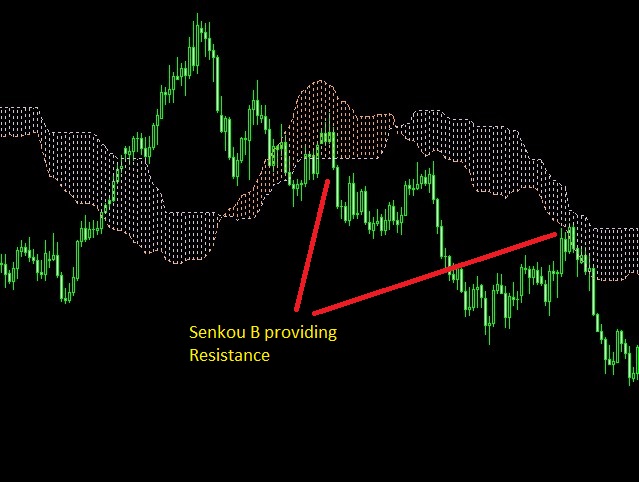 Figure 2.15: Senkou B offering resistance to the price
What Senkou A and Senkou B Tell Us About the Trend:
If Senkou A is above Senkou B, it is considered bullish.
If Senkou A is below Senkou B, it is considered bearish.
The reason for this is simple. The Senkou A is a faster averaging indicator compared to Senkou B.
Thus, when a stock is rising, Senkou A will have higher values than would Senkou B. Conversely,
when prices are declining, Senkou A by definition will move faster and decline before Senkou B
does.
What Kumo Tells Us About the Trend:
If the current price is above the Kumo, the trend is considered bullish.
If the current price is below the Kumo, the trend will be considered bearish.
If the current price is within the Kumo, the trend is said to be consolidating.
How Kumo Twist Anticipates a Trend Change:
At some point during a trend, the demand-supply equation will change and price will reverse course.
It will have to cross the Kumo to the other side and establish a new trend. Since the two components
of the Kumo are plotted 26 periods in the future, the Ichimoku system gives a good idea of when
investor sentiment is changing.
Remember that Senkou A is faster moving than Senkou B. If a stock is in an uptrend, Senkou A will be
above Senkou B. When investor sentiment starts reversing, its repercussions will be seen in the future
Kumo. In such a case, Senkou A will move below Senkou B. This crossover, referred to as a Kumo
Twist, should alert the trader to a possible end of the current trend and, in some cases, a trend
reversal.
Figure 2.16 shows Yes Bank in a strong uptrend till the end of February. Notice how the Kumo was
rising during this period with Senkou A above Senkou B. However, at the end of February, the future
Kumo had a bearish twist. This would have alerted traders that the current uptrend might be over and
that it might be time to liquidate the entire position.
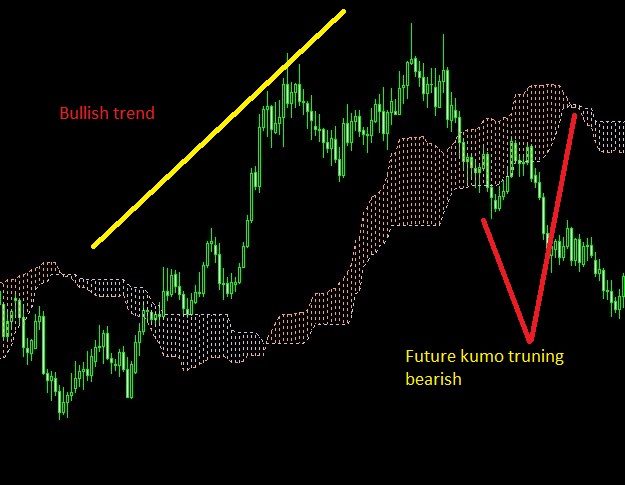 Figure 2.16: Future Kumo forewarns of trend change
Traders should also keep in mind that price will have relative ease in breaking through to the other
side of the Kumo if the Kumo’s width is thin.
A flat Senkou B can provide strong support / resistance to the price depending on the nature of
approach.
A flat Senkou B means a steady equilibrium of prices.
A trending Senkou A and B, which I refer to as a Kumo in flux, has a lesser chance to halt the price.
Figure 2.17 shows Reliance Capital breaking to the Kumo upside in January 2014 as both Senkou A
and Senkou B were trending down; Kumo was then in a flux. In April, as the price started coming
down, it initially found support on the flat Senkou B. But notice that when it then ran out of this strong
upport, it broke the Kumo to the downside.
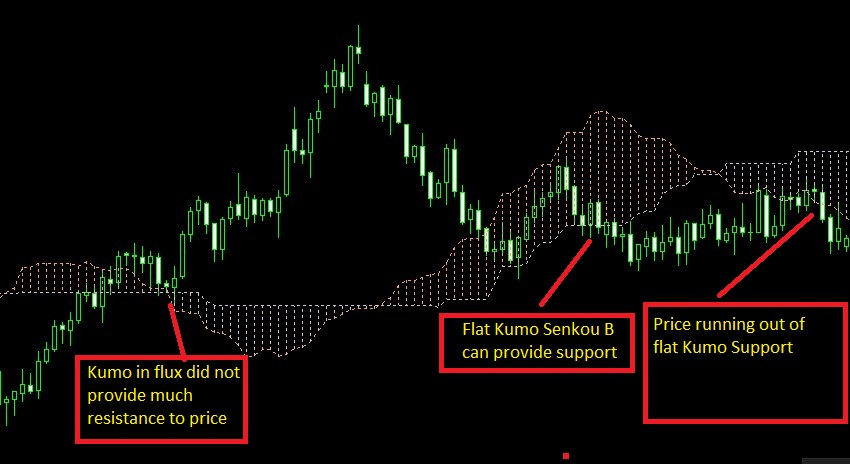 Figure 2.17: Trend reversal in Reliance Capital
Chikou
The Chikou is a simple yet powerful component of Ichimoku. It is the curret price shifted back 26
periods.
The Chikou is also the most misunderstood indicator of the Ichimoku system. Its simple nature masks
its immense potential. Many traders disregard it on their charts either for a lack of understanding or
because they think it to be too simple to be useful. Do not make this mistake. Chikou provides
powerful information to the trader as you will witness. Here is how:
If Chikou is above the price of 26 days ago, then the chart is bullish.
If Chikou is below the price of 26 days ago, it is considered bearish.
Figure 2.18 shows a bearish chart
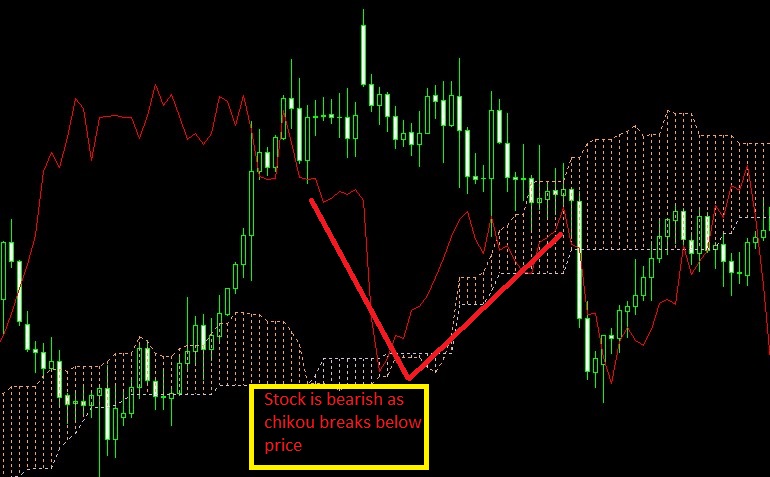 Figure 2.18: Chikou below the price of 26 days ago indicates bearish sentiment
Figure 2.19 shows a bullish chart.
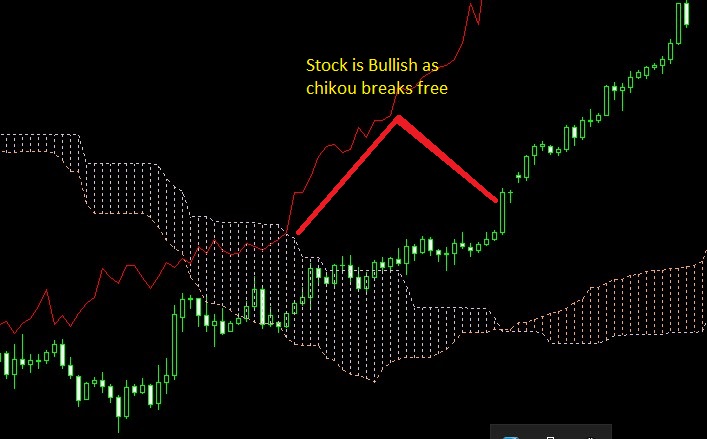 Figure 2.19: Chikou above the price of 26 days ago indicates bullish sentiment
The idea behind the Chikou is that the price level from 26 days ago will either act as resistance, or
support, as the case may be. Markets have memory. Think about it for a moment. When you buy a
stock and it goes down, what do you hope for? A breakeven! You want the stock to do nothing more
than get back to the price you bought it for. At that point, you don’t care about making even a single
rupee. All you want is your hard earned money, your capital, back. This creates a supply zone /
resistance zone for the stock. For example, for the stock to go any higher in Figure 2.20, demand will
have to overcome the available supply.
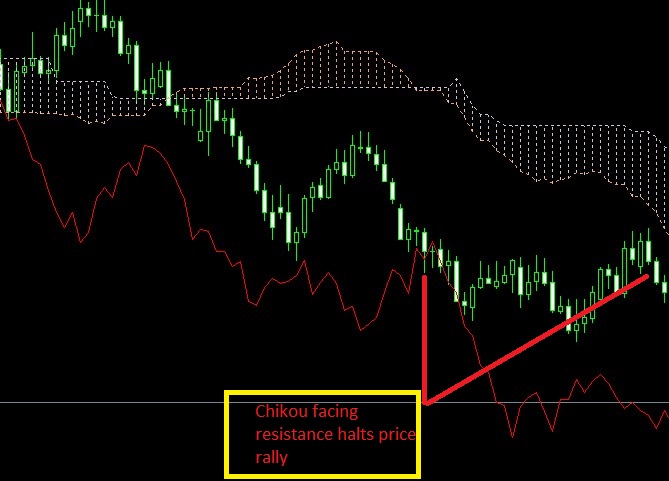 Figure 2.20: Chikou facing resistance from 26 days prior candles
A corresponding scenario holds true for the reverse side. If you either shorted a stock or missed
buying it at a particular level, and the stock has now come back to the same level, wouldn’t you want
either to cover the short or jump into the stock at this point, as the case may be.Forex trading strategy Ichimoku Kinko Hyu final addition pro Most likely you will.
This creates a demand zone, or support zone, for the stock (see Figure 2.21). For the stock to go
lower, this demand will have to be overwhelmed by the supply
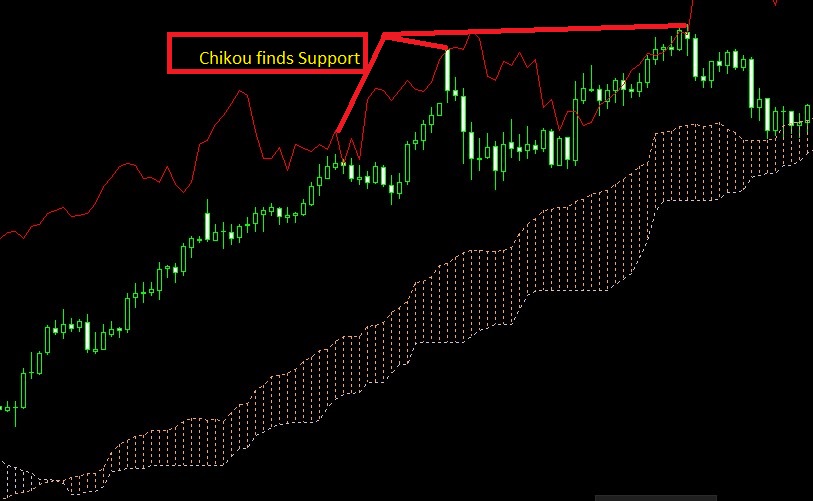 Figure 2.21: Chikou finds support on candles from 26 days ago
Ichimoku Trading System:
Now that the reader is familiar with the five components of Ichimoku, it is time to integrate them all
into a trading system. A system will ensure the trader that all aspects of Ichimoku are working in
harmony with each other. A system can use any strategy, but should be rule-based in nature.
Individual traders have unique personalities and each one may find one strategy more suitable than the
others. That is exactly how it should be in trading. One trader can make tens of million using one
strategy. Another trader might fail miserably using that same strategy. The difference being their
personality.
Here are the five commonly used Ichimoku trading strategies:-
1. Tenkan / Kijun Cross.
2. Kumo Breakout.
3. Kijun Cross.
4. Chikou Breakout.
5. Kumo Twist.
In this chapter, we will look at the basics of each strategy. The first two strategies are then further
discussed in depth, and with many, many examples in Chapters 4 and 5. They are my favorite
strategies and work with an extremely high degree of success. If you wish to use the other three
strategies, you can design rules similar to the ones described for the first two.
Tenkan / Kijun Cross Strategy (T/K Cross)
Basic Principle:
Long positions are initiated when the Tenkan crosses the Kijun to the upside.
Short positions are initiated when the Tenkan crosses the Kijun to the downside.
According to Ichimoku, the effectiveness of the T/K cross depends on its location with respect to the
Kumo:
If a bullish T/K cross occurs above the Kumo, it is considered a strong bullish signal.
If a bullish T/K cross occurs below the Kumo, it is considered a weak bullish signal.
If a bullish T/K cross occurs within the Kumo, it is considered a neutral bullish signal.
Correspondingly, on the bearish side:
If a bearish T/K cross occurs above the Kumo, it is considered a weak bearish signal.
If a bearish T/K cross occurs below the Kumo, it is considered a strong bearish signal.
If a bearish T/K cross occurs within the Kumo, it is considered a neutral bearish signal.
Let us look at each example that follows to understand these points clearly.
Figure 3.1 shows a strong bullish T/K cross because it occurred above the Kumo.
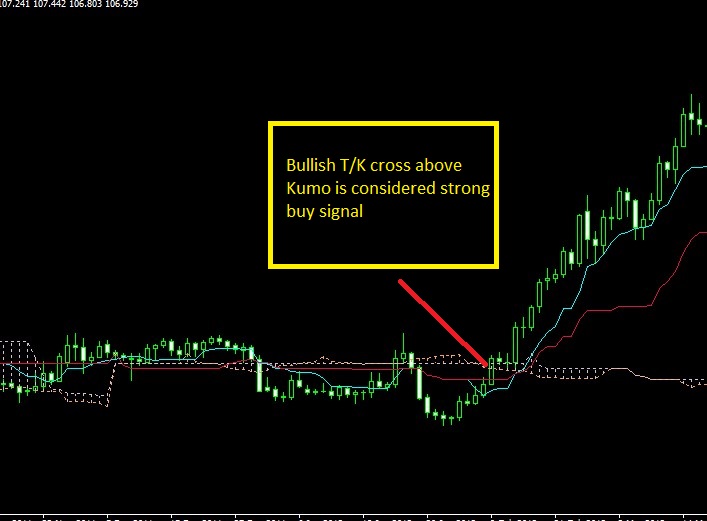 Figure 3.1: Strong bullish signal as the bullish T/K cross occurs above the Kumo cloud
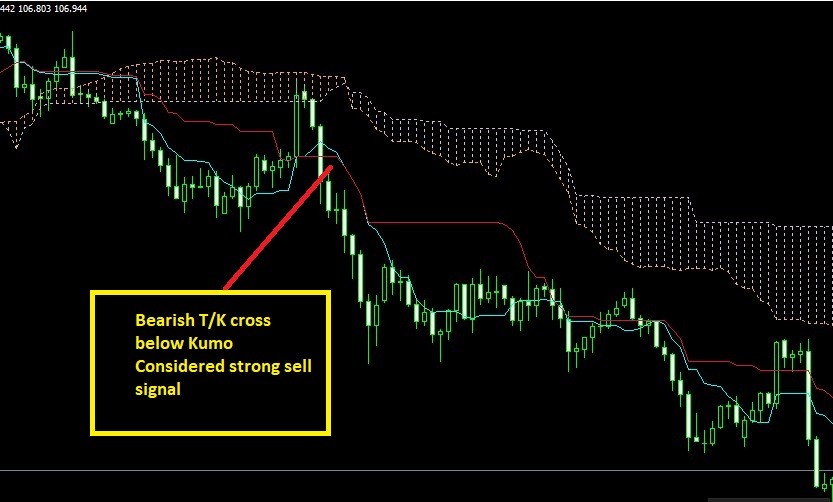 Figure 3.2: Strong bearish T/K cross occurring below the Kumo
Kumo Breakout Strategy:-
Basic Strategy:
Long positions are initiated when price breaks and closes above the Kumo.
Short positions are initiated when prices break and close below the Kumo.
As mentioned earlier, the Kumo is central to Ichimoku. When prices are above the Kumo, the chart is
considered bullish and when prices are below the Kumo, the chart is considered bearish. The chart in
Figure 3.3 shows a long position entry as the price closes above the Kumo.
Figure 3.3 shows a bullish Kumo break. Traders can enter a long position on strength, meaning above
the high of the signal candle.
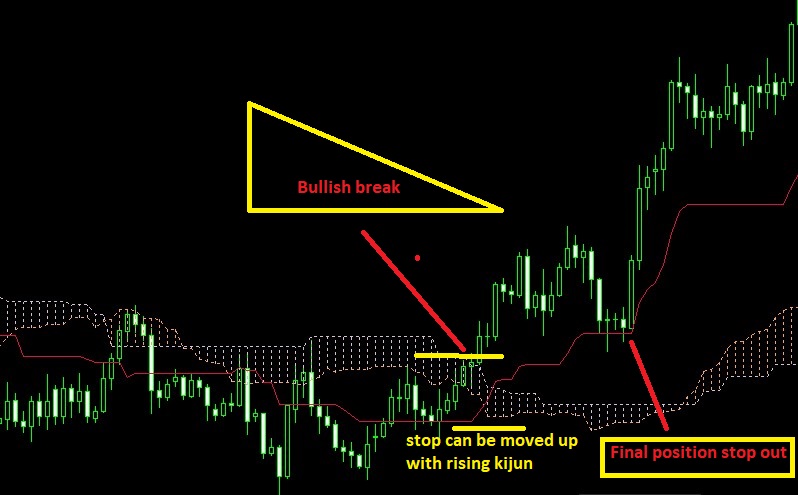 Figure 3.3: Bullish Kumo break as the price closes above the Kumo
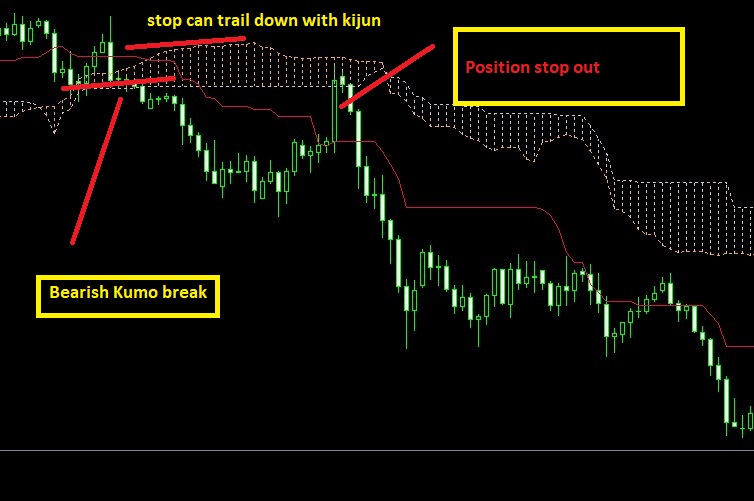 Figure 3.4: Bearish Kumo break as the price closes below the Kumo
Stop Setting:
Initially the stop loss is set either above or below the Kijun with a small buffer depending upon if the
trade is bearish or bullish, respectively. As the position moves in the anticipated direction, it will
continue to draw the Kijun with it. This enables the trader to trail his or her stop out level with the
Kijun.
Trade Exit:
It is very important for the trader to take partial profits on an ongoing basis as the position moves in
his favor. The final position can be exited in any of the following ways:
Get stopped out as the price moves through the buffer area beyond the Kijun.
Close out the position as price closes above / below the Kijun
———————————————————-
Kijun Cross:-
Basic Strategy:
Initiate long position when price closes above the Kijun.
Initiate short position when price closes below the Kijun.
According to Ichimoku, the effectiveness of the Kijun cross depends on its location with respect to the
Kumo.
If price closes above the Kijun and this crossover is above the Kumo, it is considered a strong
bullish signal.
If price closes above the Kijun but the crossover is below the Kumo, it is considered a weak
bullish signal.
If the price closes above Kijun and it is within the Kumo, it is considered a neutral bullish signal.
Correspondingly, on the bearish side:
If the price closes below the Kijun and it is below the Kumo, it is considered a strong bearish
signal.
If the price closes below Kijun and it is above the Kumo, it is considered a weak bearish signal.
If the price closes below Kijun and it is within the Kumo, it is considered a neutral bearish signal.
Let’s review the charts below for understanding these nuances.
shows Price / Kijun cross in the chart of Jaiprakash Power. Since the cross is above the
Kumo, a strong bullish signal.
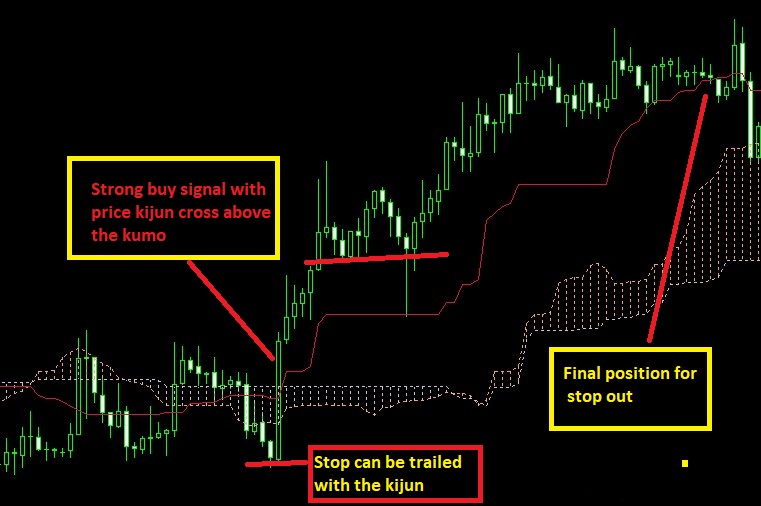 Figure 3.5: Strong bullish signal as the price crossover of Kijun is above the Kumo
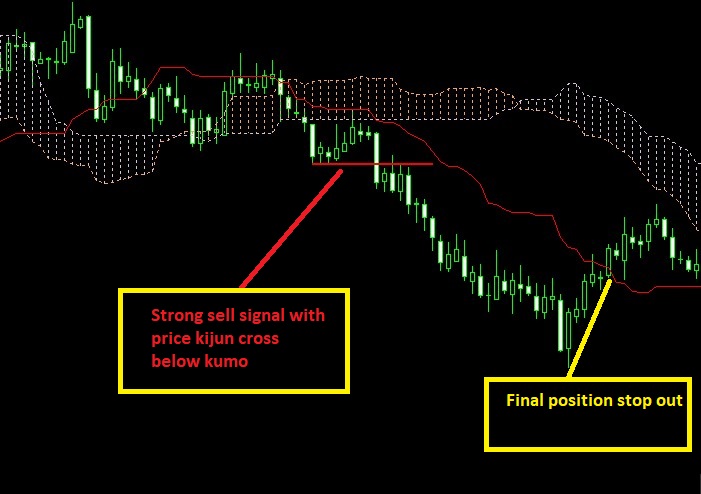 Figure 3.6: Strong bearish price cross with Kijun below the Kumo
Stop Loss Setting:
For the Kijun cross strategy, the stop loss is initially set below the Kijun with a small buffer. As the
position moves in the anticipated direction, it will continue to draw the Kijun with it. This enables the
trader to trail his stop level with the Kijun.
Trade Exit:
It is very important for the trader to take partial profits on an ongoing basis as the position moves in
his favor. The final position can be exited in any of the following ways:
Get stopped out as the price moves through the buffer area below the Kijun.
Close out position when the price closes below the Kijun.
Chikou Breakout:-
Basic Strategy:
Initiate long position when Chikou crosses and closes above the price of 26 days ago.
Initiate short position when Chikou crosses and closes below the price of 26 days ago.
As a trader you should visually ascertain if there will be any immediate resistance to the Chikou
within the next few trading periods as the current price moves up or down. This is important because
the Chikou needs to be free for the trend to continue.
According to Ichimoku, the effectiveness of the Chikou cross, or breakout, depends on the location of
the current price with respect to the Kumo.
If the Chikou closes above the price of 26 days ago, and the current price is above the Kumo, it is
considered a strong bullish signal.
If the Chikou closes above the price of 26 days ago, but the current price is below the Kumo, it is
considered a weak bullish signal.
If the Chikou closes above the price of 26 days ago, and the current price is within the Kumo, it is
considered a neutral bullish signal.
Correspondingly, on the bearish side:
If the Chikou closes below the price of 26 days ago, and the current price is below the Kumo, it is
considered a strong bearish signal.
If the Chikou closes below the price of 26 days ago, but the current price is above the Kumo, it is
considered a weak bearish signal.
If the Chikou closes below the price of 26 days ago and the current price is within the Kumo, it is
considered a neutral bearish signal.
The examples that follow depict the different scenarios listed above.
Figure 3.7 shows the chart of Bombay Dyeing displaying a strong buy signal as the Chikou crosses
above the price of 26 days ago, and the current price is above the Kumo.
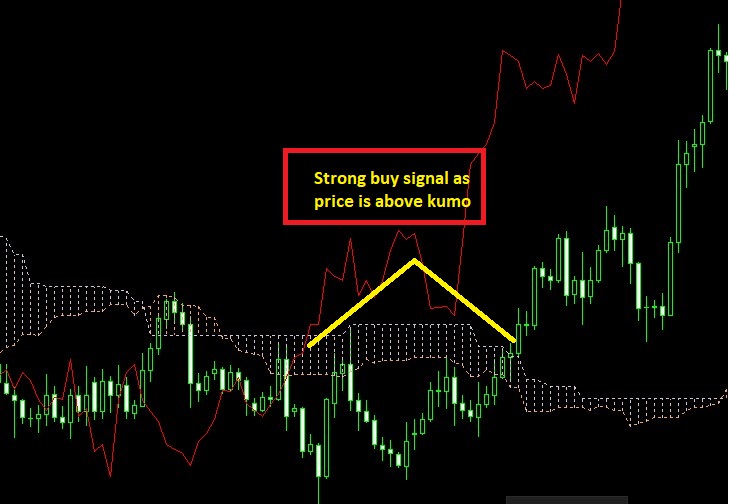 Figure 3.7: Strong bullish signal — the Chikou crosses above the price of 26 days ago, and the current price is
above the Kumo
The Atlas Cycle chart in Figure 3.18 shows a strong sell signal as the Chikou crosses below the price
from 26 days ago and the current price is below the Kumo.
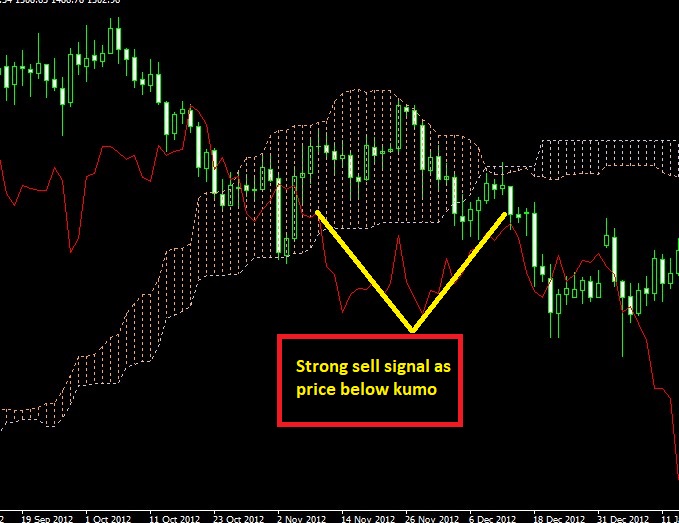 Figure 3.8: Strong sell signal — the Chikou crosses below the price from 26 days ago and the current price is
below the Kumo
Stop Loss Setting:
Again, the Kijun can be used as a stop loss level in the Chikou breakout strategy. The trader should
trail the stop loss with the Kijun as it advances / declines with the price, depending on whether the
trade is long or short.
Trade Exit:
It is very important for a trader to take profits on an ongoing basis as the position moves in his favor.
The final position can be exited in any of the following ways:
Get stopped out as the price moves through the buffer area above, or below, the Kijun, as the case
may be.
Close out the position as the price closes above / below the Kijun, respectively, depending on
whether the trade is long or short.
————————————————————-end——————————————————————–


