 Earn Money Forex Best Forex Trading Experience


Bollinger Band Strategies get profit (Part-4) Friends……. Thanks a lot for visiting earnmoneyfx.com
earnmoneyfx.com research team suggest Bollinger Brand Entry-Exit strategies as below,
- Candlesticks Pattern with Bollinger Band
- Double Top Chart Pattern with Bollinger Band
- Double Bottom Chart Pattern with Bollinger Band
- Reversal or Counter Candlesticks with Bollinger Band
- Trend line Breakout with Bollinger Band
- Swing Trading with Middle Brand (20 Simple Moving Average) Bollinger Band
- 200 Simple Moving Average with Bollinger Band
- Walking with Bollinger Band etc.
Bollinger Brand Entry-Exit Strategy (Part -1) we have discussed Candlesticks Pattern with Bollinger Band and Double Top Chart Pattern with Bollinger Band.
Bollinger Brand Entry-Exit Strategy (Part -2) we have discussed Double Bottom Chart patterns with Bollinger Band and Reversal or Counter Candlesticks with Bollinger Band.
Bollinger Brand Entry-Exit Strategy (Part -3) we have discussed Trend line Breakout with Bollinger Band.
If you missed all or anyone, Earnest request you to visit Bollinger Band Entry-Exit Strategy (Part -1), Bollinger Band Entry-Exit Strategy (Part -2), and Bollinger Band Entry-Exit Strategy (Part -3) in earnmoneyfx.com
This article earnmoneyfx.com research teams try to cover another strategy as below.
*** Swing Trading with Middle Brand (20 Simple Moving Average) Bollinger Band ***
Let’s explore ……….
Swing Trading with Middle Band (20 Simple Moving Average) Bollinger Band:
Before exploring Swing Trading with Middle Brand (20 Simple Moving Average) Bollinger Band at first we learn to know what is Simple Moving Average, What is Bollinger Middle Band, and what is swing trading.
What is a Simple Moving Average?
Moving Average is various types. E.g. Simple Moving Average (SMA), Exponential Moving Average (EMA), Smoothed Moving Average (SMMA), etc.
Simple Moving Average (SMA) is the most used of them because it’s easy to calculate and understand.
Definition and Calculation of Simple Moving Average (SMA):
A simple moving average is formed by calculating the average price of a currency over a specific number of periods.
Most moving averages are based on closing prices; for example, a 5-day simple moving average is the five-day sum of closing prices divided by five.
As its name implies, a moving average is an average that moves.
Old data is dropped as new data becomes available, causing the average to move along the time scale.
The example below shows a 5-day moving average evolving over three days.
- Daily Closing Prices: 11,12,13,14,15,16,17
- First day of 5-day SMA: (11 + 12 + 13 + 14 + 15) / 5 = 13
- Second day of 5-day SMA: (12 + 13 + 14 + 15 + 16) / 5 = 14
- Third day of 5-day SMA: (13 + 14 + 15 + 16 + 17) / 5 = 15
The first day of the moving average simply covers the last five days.
The second day of the moving average drops the first data point (11) and adds the new data point (16).
The third day of the moving average continues by dropping the first data point (12) and adding the new data point (17).
In the example above, prices gradually increase from 11 to 17 over a total of seven days.
Notice that the moving average also rises from 13 to 15 over a three-day calculation period.
Also, notice that each moving average value is just below the list price. For example, the moving average for day one equals 13 and the last price is 15. Prices the prior four days were lower and this causes the moving average to lag.
For your kind information, Any moving average strategy is a trend trading system.
Moving Average works well when prices are up to trend or downtrend.
In a choppy or sideways market moving average strategies are unable to well.
So we always avoid using moving average strategies when markets are choppy or sideways.
Otherwise, it’s chance to hit stop loss more and more.
Simple Moving Average is the default indicator in Metatrader4 or Metatrader5.
Metatrader4 Simple Moving Average plot as below
Open Metatrader4 > Insert > Indicator > Trend > Moving Average> Simple > OK
What is Bollinger Middle Band?
We know, Bollinger Band is very simple. It has three parts. Upper Band, Middle Band, and Lower Band.
Upper Band and Lower Band are volatility-based bands. Volatility based on standard deviation. By using standard deviation volatility increases and decrease. Usually, standard deviation 2 is set in the upper brand and lower brand.
When volatility increases the band automatically widens and when volatility decreases the band automatically contracts.
Middle Brand is 20 Simple Moving Average. Simple Moving Average uses the standard deviation formula thus 20 Simple Moving Average uses the Bollinger band as a middle brand.
Calculation of Bollinger Band:
* Middle Band = 20-day simple moving average (SMA)
* Upper Band = 20-day SMA + (20-day standard deviation of price x 2)
* Lower Band = 20-day SMA – (20-day standard deviation of price x 2)
What is Swing Trading?
Price never goes up or down with straight. Price always goes up or down with a zigzag or swing.
In the Forex, Stock, and Commodities market various types of traders execute their trading. E.g. Position Trader, Breakout Trader, Momentum Trader, Swing Trader, Day Trader, and scalper, etc.
Swing Trading is short-term trading where traders try to achieve a profit within a short period by using price swing.
Swing traders basically use technical analysis to capture swing profit. Little time they add fundamental analysis for confluence.
Swing trader always likes to trade trending market. They always avoid the sideways market.
Swing traders never invest in the long term. They always invest for short term e.g. In daily chart five to ten days. They execute their buy-sell in chart swing point.
Let’s enjoy how to enter and exit Swing Trading with Middle Brand (20 Simple Moving Average) Bollinger Brand.
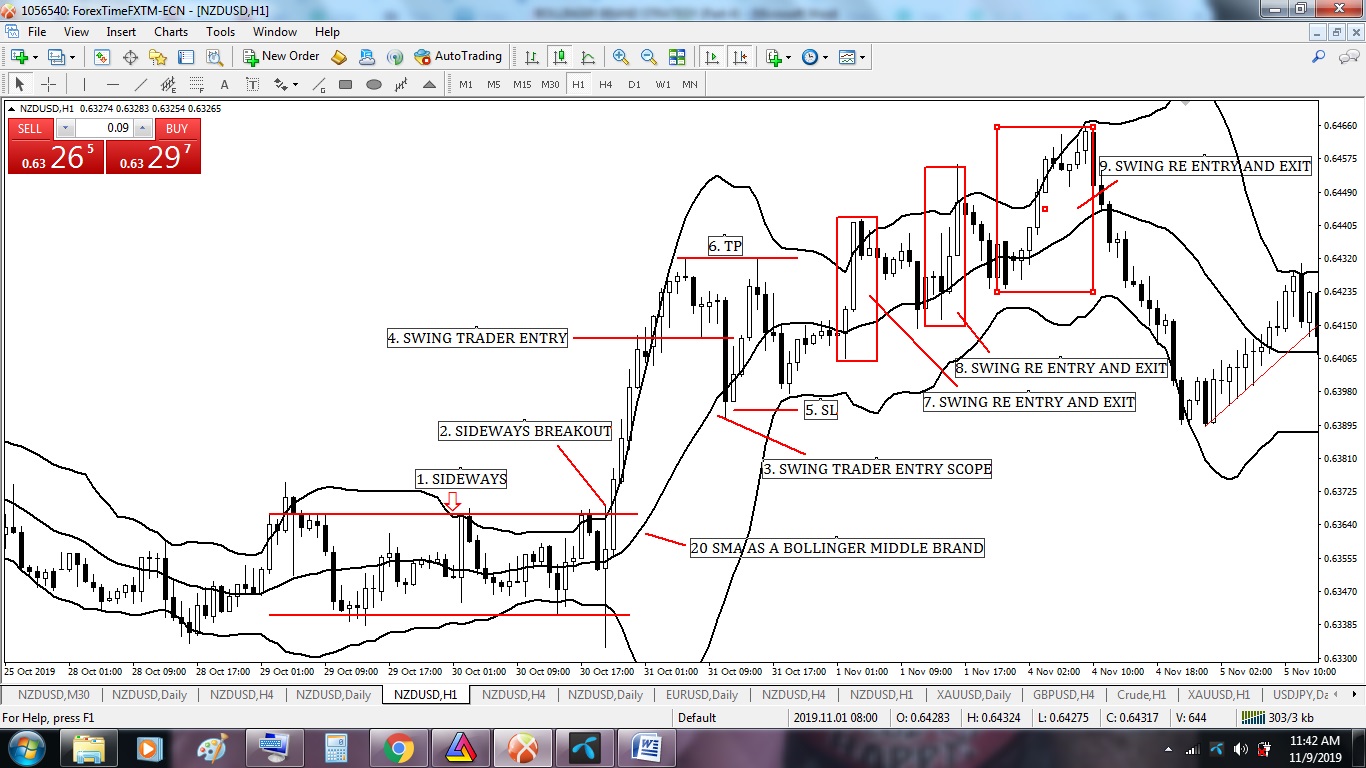
Swing Trading with Middle Band (20 Simple Moving Average) Bollinger Band Entry-Exit Strategy with Breakout Structure.
Image point number – 1, We see the market is fully sideways. As swing traders, we have nothing to do now. We have to wait for breakout sideways either up or down.
Image point number – 2, Candlesticks breakout sideways market. This time as swing traders we have nothing to do now. We have to wait for the price to come back to 20 SMA or Bollinger Middle Brand.
Image point number – 3, Candlesticks come back to 20 SMA or Bollinger Middle Brand. Now we have to wait for reversal candlesticks pattern which must close above 20 SMA or Bollinger Middle Band.
Image point number – 4, Aggressive or conservative trader put their BUY STOP order 2 pips above of this reversal candlestick.
Image point number – 5, After hitting BUY STOP order aggressive trader place STOP LOSS 2 pips below of reversal candlestick. Conservative trader place STOP LOSS 2 pips below of swing low.
Image point number – 6, Conservative or aggressive trader place their take profit level on the near swing high or 1: 2 or 1 : 3 risk-reward ratio.
Image point numbers – 7, 8, and 9, Another swing trading entry and exit as per rules.

Swing Trading with Middle Band (20 Simple Moving Average) Bollinger Band Entry-Exit Strategy with Chart Pattern Structure.
Image point number – 1, We see the market is fully uptrend. We have to wait to create any chart pattern.
Image point number – 2, Double top pattern created. But as swing traders, we have nothing to do.
Image point number – 3, Candlesticks break down the double top neckline. But as a swing trader, we do not enter here. Now we have to wait for the price to come back 20 SMA or Bollinger Middle Brand.
Image point number – 4, Candlesticks come back to 20 SMA or Bollinger Middle Brand. Now we have to wait for reversal candlesticks pattern which must close below 20 SMA or Bollinger Middle Brand.
Image point number – 5, Aggressive or conservative trader put their SELL STOP order 2 pips below of this reversal candlestick.
Image point number – 6, After hitting SELL STOP order aggressive trader place STOP LOSS 2 pips above of reversal candlestick. Conservative traders place STOP LOSS 2 pips above or swing high.
Image point number – 7, Conservative or aggressive trader place their take profit level on the near swing low or 1: 2 or 1 : 3 risk-reward ratio.
Image point number – 8 and 9, Another swing trading entry and exit as per rules.
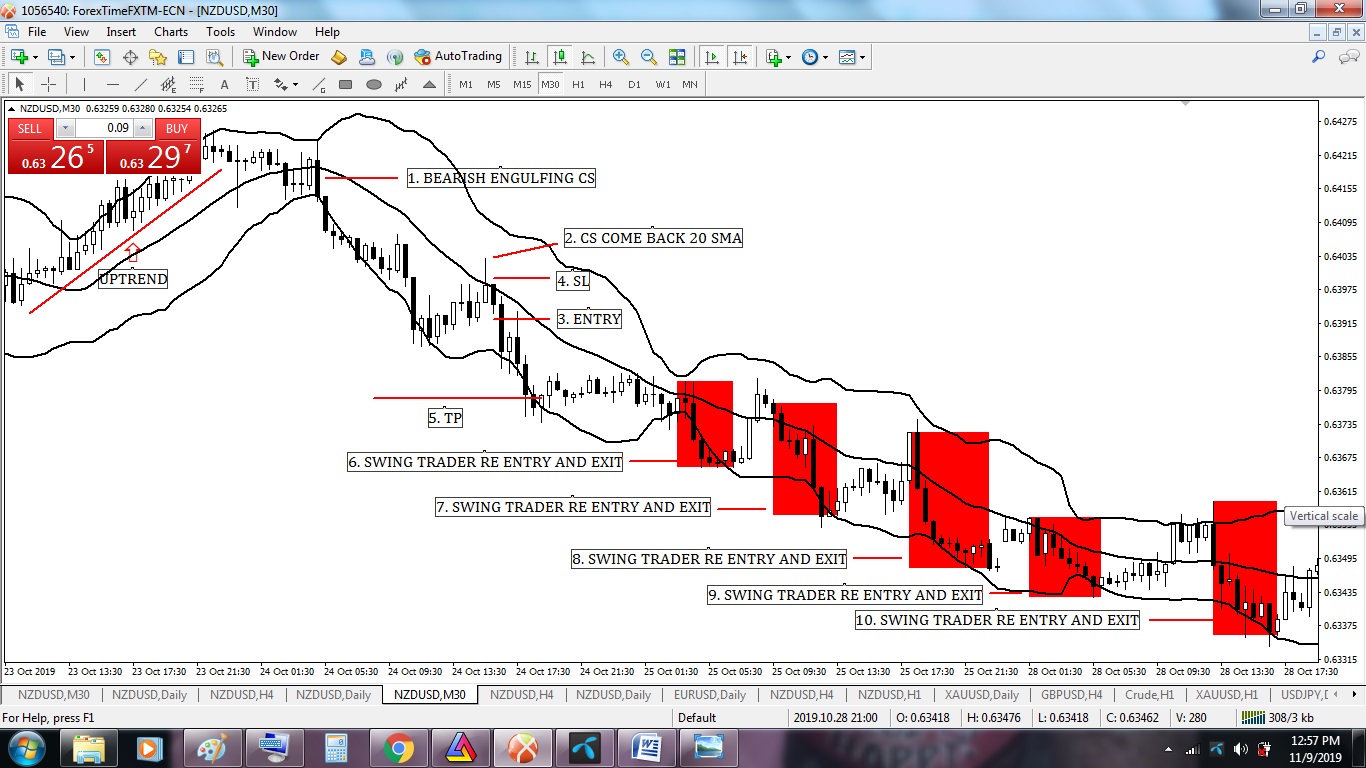
Swing Trading with Middle Band (20 Simple Moving Average) Bollinger Band Entry-Exit Strategy with Candlesticks Pattern Structure.
Image point number – 1, We see the market is fully uptrend. We have to wait to create any reversal candlesticks pattern.
Bearish Engulfing pattern created. But as swing traders, we have nothing to do.
Image point number – 2, Candlesticks come back to 20 SMA or Bollinger Middle Brand. Now we have to wait for reversal candlesticks pattern which must close below 20 SMA or Bollinger Middle Brand.
Image point number – 3, Aggressive or conservative trader put their SELL STOP order 2 pips below of this reversal candlestick.
Image point number – 4, After hitting SELL STOP order aggressive trader place STOP LOSS 2 pips above of reversal candlestick. Conservative traders place STOP LOSS 2 pips above or swing high.
Image point number – 5, Conservative or aggressive trader place their take profit level on the near swing low or 1: 2 or 1 : 3 risk-reward ratio.
Image point numbers – 6, 7, 8, 9, and 10, Another swing trading entry and exit as per rules.
Using Bollinger Bands to Gauge Trends
——- Thanks for giving your valuable time to read this article ——–


